. 2010 Oct 19;18(4):367-81.
doi: 10.1016/j.ccr.2010.09.005.

RETRACTED: Downregulation of p53-inducible microRNAs 192, 194, and 215 impairs the p53/MDM2 autoregulatory loop in multiple myeloma development

Affiliations

RETRACTED: Downregulation of p53-inducible microRNAs 192, 194, and 215 impairs the p53/MDM2 autoregulatory loop in multiple myeloma development

Flavia Pichiorri et al. Cancer Cell. .

Erratum in

Retraction in

Abstract

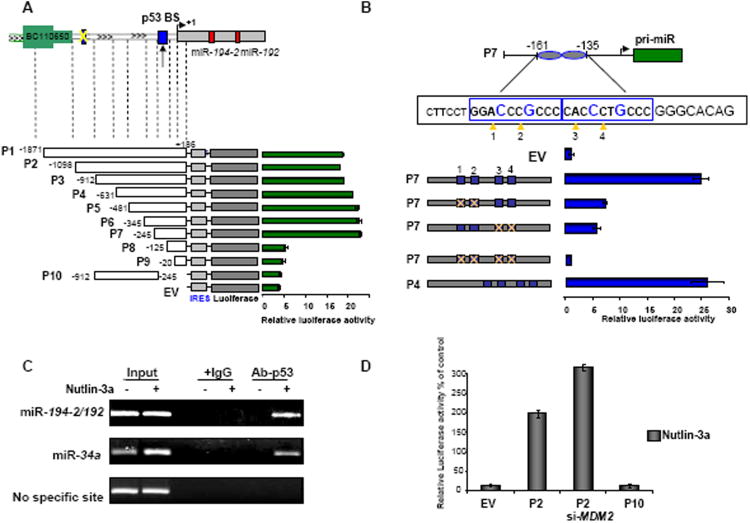
This article has been retracted: please see Elsevier Policy on Article Withdrawal (http://www.elsevier.com/locate/withdrawalpolicy). This article has been retracted at the request of the editors. This article was published on October 19, 2010, and Figures 4A and 7A were later corrected on August 8, 2016. In January 2021, The Ohio State University notified the Cancer Cell editors that an internal investigation concluded that Figures 1E, 4A, 4D, 5A, and 7A were falsified and that part of Figure 1E of the article is the same as part of Figure 1F in the correction of another article (Pichiorri et al., 2017, J. Exp. Med., 214, 1557, https://doi.org/10.1084/jem.2012095001172017c) and recommended retraction of the article. The editors no longer have confidence in the validity of the data and are retracting the article. S.-S. S. agrees with the retraction, and F.P., C.H., A.P., and C.M.C. disagree with the retraction; all other authors couldn't be reached or didn't respond.


Figures

Figure 1
Figure 1. Identification of p53-regulated miRNAs in MM cells
A) Overview of two-way (genes against samples) hierarchical cluster (Euclidean distance) of 6 MM cell lines in duplicate using the genes that vary the most between samples. As shown, the clustering is mainly determined by the presence of WT TP53 expression (NCI-H929, MM 1s and KMS28BM) or mutant/null TP53 (U266, RPMI-8226, JJN3) in the cell lines. In magnification are reported the miRNAs up-regulated more than 3-fold in WT TP53 cell lines with p< 0.001. See also figure S1 and table S1. B)-Overview of two-way of MM1s cells treated with 10 μM Nutlin-3a overnight (biological quadruplicate) and with DMSO (biological triplicate) using the genes that vary the most between samples. As shown, the clustering is mainly determined from the Nutlin-3a treatments and DMSO treatment. Color areas indicate relative expression of each gene with respect to the gene median expression (red above, green below the median value, and black, samples with signal intensity to background of 2 or less). See also figure S1 and table S2. Western blot analysis of p53, MDM2, phosphor(p)-MDM2, c-MYC, p21 and Gapdh (C) and time course of CDKN1A mRNA expression by RT-PCR in Nutlin-3a treated (10μM) MM1s cells (D). The PCR products were normalized to ACTIN expression. Values represent mean observed in 4 different studies ± SD. (E) Kinetics of miR-194, miR-192, miR-215 and miR-34a in MM1s cells after Nutli-3a treatment, measured by qRT-PCR and Northern blot analysis. Lines represent relative fold-changes between DMSO and Nutlin-3a treatment ± SD. RNU44 (qRT-PCR) and RNU6B (Northern blot) expression was used for normalization. See also figure S1. (F-H) miR-192, miR-215 and miR-194 relative expression in CD138+ PCs from healthy, MGUS and MM samples (see Table S3) were determined by Taqman q-RT PCR assay. Each data sample was normalized to the endogenous reference RNU44 and RNU48 by use of the 2– ct method. The relative expression values were used to design box and whisker plots. Dots in the boxes indicate outlier points. Kruskal-Wallis analysis assessed that the 3 miRNAs were differentially expressed among MGUS samples versus MM PCs samples of the Bartlett test p ≤.001.
Figure 2
Figure 2. miR-194-2-192 cluster is induced following p53 activation
A) Luciferase reporter activity of promoter constructs of miR-192-194-2 cluster on chromosome 11q13.1 in MM1s cells after p53 transfection ± SD. The arrow above construct P1 indicates the position of the transcription start site +1. p53 binding sites (BD) are indicated (blue box). B) Relative luciferase activity of P7 reporter construct. The magnified sequence highlighted in blue shows the location of the El Deiry p53 consensus binding sites in P7 construct sequence. Deletions introduced into the P7 construct are shown in yellow (X) showing abolition of the promoter activity. C) Chip assay after 24 hr of p53 non genotoxic activation, showing binding of p53 to the miR-192-194-2 cluster promoter in vivo in MM1s cells. D) Luciferase activity of empty vector (EV), P2 and P10 reporter constructs after non genotoxic activation of p53 and MDM-2 mRNA silencing. Luciferase activities were normalized by Renilla luciferase activities. Values represent mean ± SD from three experiments. See also figure S2.
Figure 3
Figure 3. miR-192-194-215 induce decrease of proliferation and cell cycle arrest in WT TP53 MM cells
MTS assay performed in MM1s (A), NCI-929 (B), KMS28BM (C) and RPMI-8226 (D) cell lines. Cells were transfected with miR-192, 194, 215 and scrambled sequence (Scr) and were harvested at 24, 48, and 72 hrs after transfection. p values are indicated. See also figure S3. E,F) Soft agar colony suppression assay in WT TP53 and mutant TP53 MM cell lines after miRNAs transduction by lentivectors. Flow cytometry analysis in MM 1s (G), NCI-H929 (H) and KMS28BM (I) cells (miR-192, 194, 215 and Scr transfected) at 48 hr of transfection, after first being arrested and synchronized in G2/M phase by Nocodazole for 16 hr. Apoptosis in KMS28BM was evaluated by caspase-3 activity (J). All experiments were performed in triplicate ±SD.
Figure 4
Figure 4. miRNA-192-194 and 215 effect on MDM2 protein and mRNA levels
A) MM1s and NCI-H929 cells (pre-miRNA-192, 194, 215, Scr sequence-transfected) were harvested at 72 hr after transfection and 12 hr Nutlin-3a treatment (10 μM) (see also figure S4). Whole cell lysates were subjected to Western blotting using p53, MDM2, p21, and Gapdh antibodies. Densitometric analysis showing the effect of miR-194 (white bars), miR-192 (grey bars), miR-215 (black bars) compared to Scr sequence (green bars) transfected cells of endogenous p53, MDM2 and p21 in MM1s ±SD. (B) and NCI-H929 (C) Nutlin-3a treated. Immununoblot analysis showing p53, MDM2 and p21 protein expression after 48 hr of miR-192, miR-194, miR-215 (pool) and Scr ASOs transfection in MM1s and NCI-H929 cells after 12 hr of treatment with 10 μNutlin-3a; Gapdh was internal loading control and densitometric analysis was reported ±SD (E). F)MDM2 mRNA expression normalized for GAPDH mRNA expresion in MM 1s and NCI-H929 cells miRNAs or Scr transfected after Nutlin-3a treatment (6-12 hr) ±SD. G) miRNAs predicted to interact with HDM2 gene in several consensus binding sites (▲) at its 3′-UTR, according to “in silico” RNA-22 prediction software. Luciferase assay showing decreased luciferase activity in cells co-transfected with pGL3-MDM2-3′UTR and miR-192, 194, 215 and Scr sequence. See also Figure S4. All experiments were performed in triplicate ±SD. E) MDM2 mRNA relative expression in CD138+ PCs from healthy, MGUS and MM samples with determined by RT-PCR. Each data sample was normalized to the endogenous reference ACTIN by use of the 2– ct method. Kruskal-Wallis analysis assessed that MDM2 mRNA is differentially expressed among the healthy and MGUS samples vs MM PCs samples (see table S3) of the Bartlett test P value (<0.01). F) Graphic of the negative Spearman correlation coefficient (ρ=-0.698) corresponding to a decreasing monotonic trend between log of MDM2 mRNA relative expression and log of miR-192 relative expression (p<0,001, N=33).
Figure 5
Figure 5. miR-192, 194 and 215 increase sensitivity to MI-219 in vitro and in vivo by targeting MDM2
A) Effects of miR-192, 194 and 215 on endogenous p53, p21 and MDM2 levels (Western blots) in MM 1s cells treated with MI-219 at different concentrations. Densitometric analysis for p53 in untreated cells and for p53 and MDM2 protein levels in 2.5, 5 and 10 μM MI-219-treated cells is reported (B) All experiments were performed in triplicate ±SD. C) Apoptotic effect at different concentrations and time points for each miRNA transfected cells was assessed by caspase-3 activation assay ±SD. D) Apoptosis associated with the pool of these miRNAs upon MI-219 treatment (24 h) at different concentration (2.5-10 μM) was evaluated by Annexin V. All experiments were performed in triplicate ±SD. E) Gfp/Luc + MM1s cells were injected subcutaneously into the flanks of nude mice; at 3 wk post-injection, mice with comparable tumor sizes were selected for treatment (untreated). In vivo confocal imaging of GFP+/Luc+ MM cells engrafted in athymic nu/nu mice after 2 wk of combined treatment with oral MI-219 or Vehicle (VE) plus pre-microRNA pool or Scr sequence directly into the tumors. Graphic represents the mean of tumors value (mm2) before (3 wk) and after the treatment (3+2 wk) ±SD.
Figure 6
Figure 6. miR-192-215 regulate IGF-1 and IGF1-R expression in MM cells
Western blot showing IGF-1R and IGF-1 expression after miR-192 and miR-215 transfection using pre (A) and ASOs (B) for miR-192, 215, 194 and Scr in MM1s cells treated for 12 hr with Nutlin-3a. Densitometric analysis is reported. See also figure S5. C) Western blots after IGF-1 knockdown in MM1s (si-RNA) using anti-IGF-1R, IGF-1 and Gapdh antibodies. D-E) miRNAs predicted to interact with IGF-1 and IGF-1R gene at their 3′-UTR, according to “in silico” Target Scan (IGF-1) and RNA-22 (IGF-1R) prediction software (see also figure S5). Luciferase assay showing decreased luciferase activity in MM 1s cells co-transfected with pGL3-IGF-1-3′UTR (D) or pGL3-IGF-1R-3′UTR (full) (E) and miR-192, 194, 215 or Scr. Deletion of 6 bases in all putative consensus sequences on IGF-1-3′-UTR abrogates these effect (Del) (D). See also Figure S5. Bars indicate relative luciferase activity ± SD. All experiments were performed in triplicate. F-G) Immunofluorescence using anti-IGF-1R (F) and anti-IGF-1 (G) in red and blue nuclear DNA, from CD-138+ PCs from 9 MM patients transfected with miR-192 and miR-215 (pool) or Scr and intensity of the signal was assessed ± SD. The efficiency of the transfection in the 9 samples was evaluated using fluorescent double strand RNA oligos (H). Scale bars indicate 25μM.
Figure 7
Figure 7. miR-194, 215 and 194 block invasion ability of MM cells
A) MM1s and RPMI-8226 cells (pre-miRNA-192, 194, 215, Scr-transfected) were harvested 72 hr after transfection. Whole cell lysates were imunoblotted using IGF-1, IGF-1 R, pS6, S6, p-Akt, Akt and Gapdh antibodies; Scr sequence and miR-194 transfected cells served as controls. The experiments were performed in triplicate. B) Intra-epithelial migration assay in MM cells miRNAs transfected using HS-5 cells at different concentrations of IGF-1 as attractant. Bars indicate relative fold change of migration compared with the control ± SD. See also figure S6. C-D) In vivo confocal imaging. 8×10⁶ GFP+/Luc+ MM1s cells were transfected using either pre-miRNA-192, -194, 215 and Scr RNA oligos and then iv injected into mice immediately after transfection. After 1 wk the mice were miRNAs iv injected (10ug) once a wk for 4 wk and the bioluminescence intensity was assessed before every injection (C). (D) Representative bioluminescence imaging (BLI) after 5 wk from the injection. (E) Bone marrow cells from the mice used for the experiment were isolated and human CD-138 positive cells (engrafted cells) were detected using anti-CD-138 antibody by flow cytometry (P2 fraction) (E).
Figure 8
Figure 8. miR-192, 215 and 194 impair the p53/MDM2 auto-regulatory loop
Model to illustrate the possible role of miR-192, 194 and 215 in control of MDM2 and IGF-1/IGF-1R pathways in MM cells. See also figure S7.

Comment in

Similar articles

Cited by

References

    1. Bartel D. MicroRNAs: Genomics, biogenesis, mechanism, and function. Cell. 2004;116:281–297. - PubMed
    1. Braun CJ, Zhang X, Savelyeva I, Wolff S, Moll UM, Schepeler T, Ørntoft TF, Andersen CL, Dobbelstein M. p53-Responsive microRNAs 192 and 215 are capable of inducing cell cycle arrest. Cancer Res. 2008;68:10094–10104. - PMC - PubMed
    1. Chang TC, Yu D, Lee YS, Wentzel EA, Arking DE, West KM, Dang CV, Thomas-Tikhonenko A, Mendell JT. Widespread microRNA repression by Myc contributes to tumorigenesis. Nat Genet. 2008;40:43–50. - PMC - PubMed
    1. Chng WJ, Glebov O, Bergsagel PL, Kuehl WM. Genetic events in the pathogenesis of multiple myeloma. Best Pract Res Clin Haematol. 2007;20:571–596. - PMC - PubMed
    1. Croce CM. Oncogenes and cancer. New England Journal of Medicine. 2008;358:502–511. - PubMed

Publication types

MeSH terms