

Structure-function analysis of the human JC polyomavirus establishes the LSTc pentasaccharide as a functional receptor motif
- PMID: 20951965
- PMCID: PMC2957469
- DOI: 10.1016/j.chom.2010.09.004
Structure-function analysis of the human JC polyomavirus establishes the LSTc pentasaccharide as a functional receptor motif
Abstract
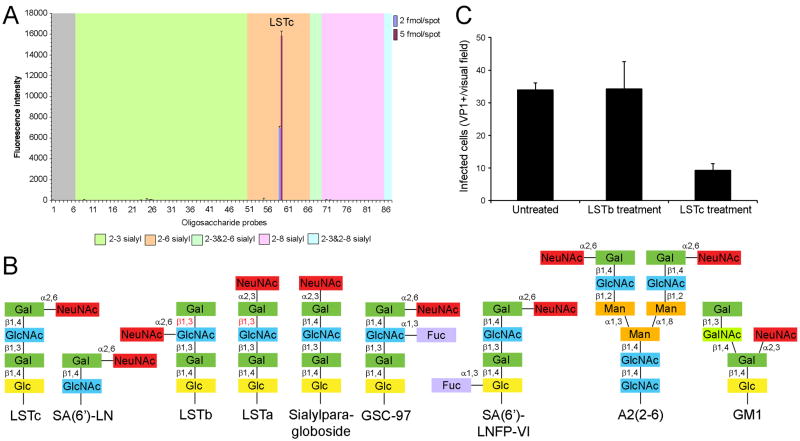
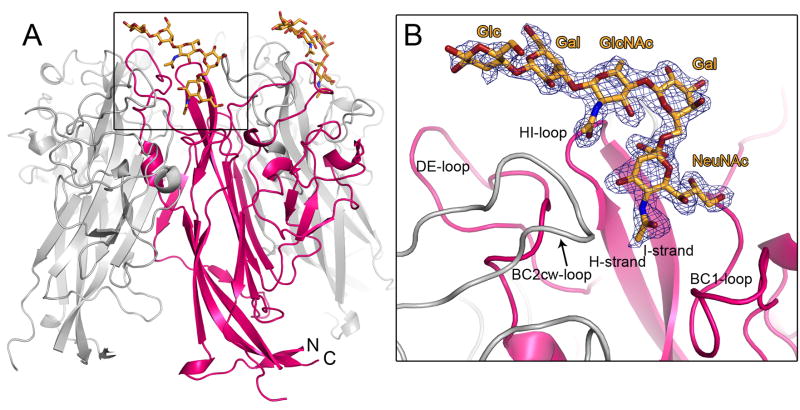
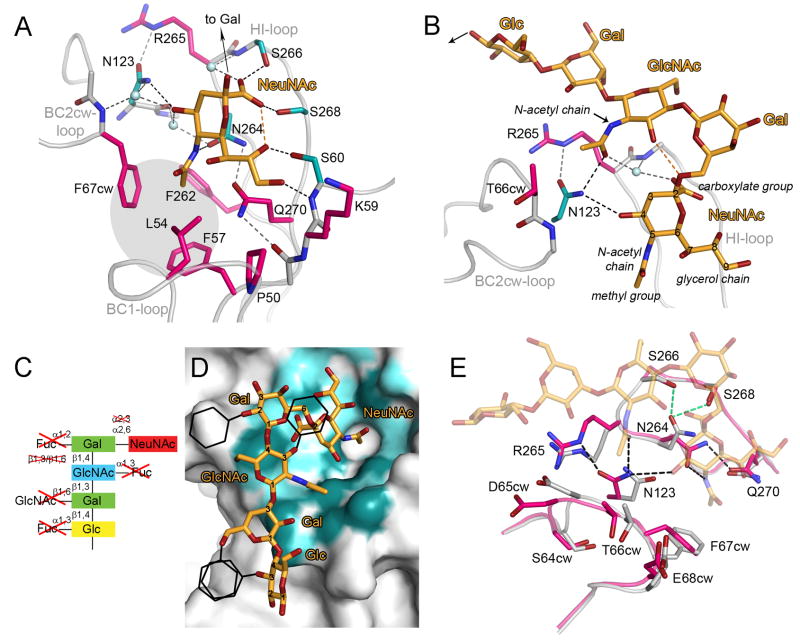
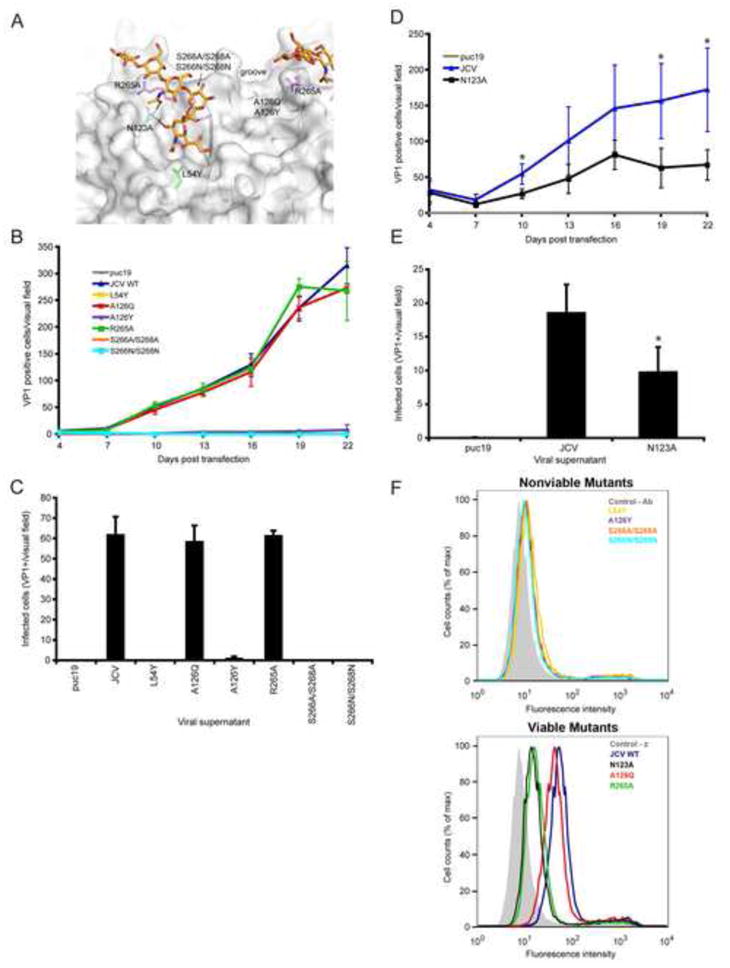
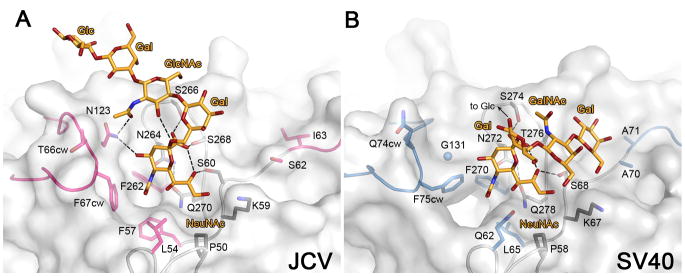
The human JC polyomavirus (JCV) causes a fatal demyelinating disease, progressive multifocal leukoencephalopathy (PML), in immunocompromised individuals. Current treatment options for PML are inadequate. Sialylated oligosaccharides and the serotonin receptor are known to be necessary for JCV entry, but the molecular interactions underlying JCV attachment remain unknown. Using glycan array screening and viral infectivity assays, we identify a linear sialylated pentasaccharide with the sequence NeuNAc-α2,6-Gal-β1,4-GlcNAc-β1,3-Gal-β1,4-Glc (LSTc) present on host glycoproteins and glycolipids as a specific JCV recognition motif. The crystal structure of the JCV capsid protein VP1 was solved alone and in complex with LSTc. It reveals extensive interactions with the terminal sialic acid of the LSTc motif and specific recognition of an extended conformation of LSTc. Mutations in the JCV oligosaccharide-binding sites abolish cell attachment, viral spread, and infectivity, further validating the importance of this interaction. Our findings provide a powerful platform for the development of antiviral compounds.
Copyright © 2010 Elsevier Inc. All rights reserved.
Figures
Similar articles
-
Progressive multifocal leukoencephalopathy-associated mutations in the JC polyomavirus capsid disrupt lactoseries tetrasaccharide c binding.mBio. 2013 Jun 11;4(3):e00247-13. doi: 10.1128/mBio.00247-13. mBio. 2013. PMID: 23760462 Free PMC article.
-
The Greater Affinity of JC Polyomavirus Capsid for α2,6-Linked Lactoseries Tetrasaccharide c than for Other Sialylated Glycans Is a Major Determinant of Infectivity.J Virol. 2015 Jun;89(12):6364-75. doi: 10.1128/JVI.00489-15. Epub 2015 Apr 8. J Virol. 2015. PMID: 25855729 Free PMC article.
-
Oligosaccharides as receptors for JC virus.J Virol. 2002 Dec;76(24):12992-3000. doi: 10.1128/jvi.76.24.12992-13000.2002. J Virol. 2002. PMID: 12438625 Free PMC article.
-
JC polyomavirus attachment, entry, and trafficking: unlocking the keys to a fatal infection.J Neurovirol. 2015 Dec;21(6):601-13. doi: 10.1007/s13365-014-0272-4. Epub 2014 Jul 31. J Neurovirol. 2015. PMID: 25078361 Free PMC article. Review.
-
The role of sialic acid in human polyomavirus infections.Glycoconj J. 2006 Feb;23(1-2):19-26. doi: 10.1007/s10719-006-5434-z. Glycoconj J. 2006. PMID: 16575519 Review.
Cited by
-
Virus-Associated Nephropathies: A Narrative Review.Int J Mol Sci. 2022 Oct 10;23(19):12014. doi: 10.3390/ijms231912014. Int J Mol Sci. 2022. PMID: 36233315 Free PMC article. Review.
-
Antibody escape by polyomavirus capsid mutation facilitates neurovirulence.Elife. 2020 Sep 17;9:e61056. doi: 10.7554/eLife.61056. Elife. 2020. PMID: 32940605 Free PMC article.
-
Virus-Receptor Interactions: The Key to Cellular Invasion.J Mol Biol. 2018 Aug 17;430(17):2590-2611. doi: 10.1016/j.jmb.2018.06.024. Epub 2018 Jun 18. J Mol Biol. 2018. PMID: 29924965 Free PMC article. Review.
-
High-Throughput Characterization of Viral and Cellular Protein Expression Patterns During JC Polyomavirus Infection.Front Microbiol. 2019 Apr 17;10:783. doi: 10.3389/fmicb.2019.00783. eCollection 2019. Front Microbiol. 2019. PMID: 31065251 Free PMC article.
-
ERK Is a Critical Regulator of JC Polyomavirus Infection.J Virol. 2018 Mar 14;92(7):e01529-17. doi: 10.1128/JVI.01529-17. Print 2018 Apr 1. J Virol. 2018. PMID: 29321332 Free PMC article.
References
-
- Acquotti D, Fronza G, Ragg E, Sonnino S. Three dimensional structure of GD1b and GD1b-monolactone gangliosides in dimethylsulphoxide: a nuclear Overhauser effect investigation supported by molecular dynamics calculations. Chem Phys Lipids. 1991;59:107–125. - PubMed
-
- Atwood WJ, Wang L, Durham LC, Amemiya K, Traub RG, Major EO. Evaluation of the role of cytokine activation in the multiplication of JC virus (JCV) in human fetal glial cells. J Neurovirol. 1995;1:40–49. - PubMed
-
- Breg J, Kroon-Batenburg LM, Strecker G, Montreuil J, Vliegenthart JF. Conformational analysis of the sialyl alpha(2–3/6)N-acetyllactosamine structural element occurring in glycoproteins, by two-dimensional NOE 1H-NMR spectroscopy in combination with energy calculations by hard-sphere exo-anomeric and molecular mechanics force-field with hydrogen-bonding potential. Eur J Biochem. 1989;178:727–739. - PubMed
Publication types
MeSH terms
Substances
Grants and funding
LinkOut - more resources
Full Text Sources
Other Literature Sources
