

doi: 10.1016/j.smrv.2010.06.003.
Epub 2010 Oct 16.
Development of pediatric sleep questionnaires as diagnostic or epidemiological tools: a brief review of dos and don'ts
Affiliations
- PMID: 20952230
- PMCID: PMC3022091
- DOI: 10.1016/j.smrv.2010.06.003
Item in Clipboard
Development of pediatric sleep questionnaires as diagnostic or epidemiological tools: a brief review of dos and don'ts
Sleep Med Rev.
2011 Feb.
Abstract
Questionnaires are a useful and extensively used tool in clinical sleep medicine and in sleep research. The number of sleep questionnaires targeting the pediatric age range has tremendously increased in recent years, and with such explosion in the number of instruments, their heterogeneity has become all the more apparent. Here, we explore the theoretical and pragmatic processes required for instrument design and development, i.e., how any questionnaire, inventory, log, or diary should be created and evaluated, and also provide illustrative examples to further underline the potential pitfalls that are inherently embedded in every step of tool development.
© 2010 Elsevier Ltd. All rights reserved.
Figures
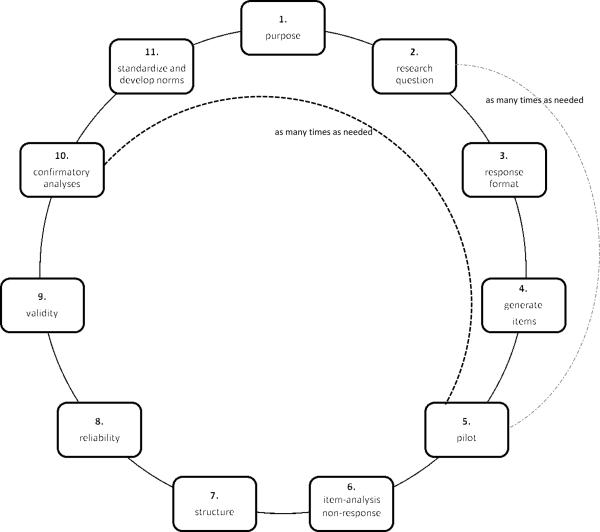
Steps in tool development
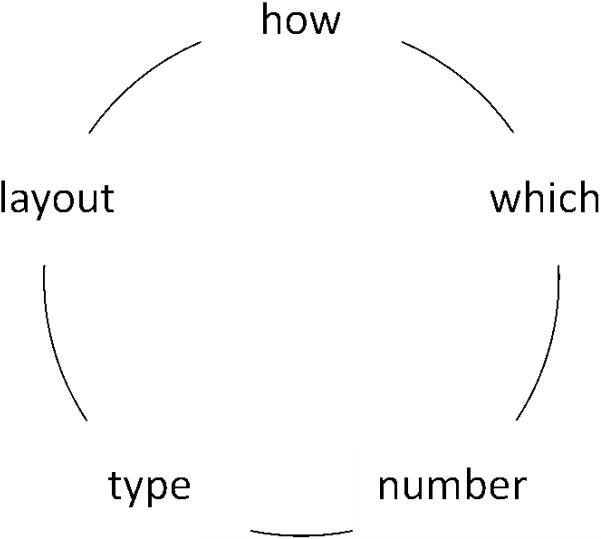
Design of tool

Example 1: I like to sleep

Example 2: from Children's Sleep Wake Scale (37) [dissertation – General Sleep Information]

Example 3: I like to sleep

Example 4: Thurstone scale A Thurnstone scale mostly applies an equal-appearing interval which is accomplished by judges rating a large set of statements in terms of how much they agree with them. Each rated statement is plotted and, median score and interquartile range is determined. Subsequently the list of statements is sorted and one selects the set of statements that are at equal positions across the range of medians, and has the lowest interquartile range for each position. Maldonado et al (39) made a pictorial version.

Example 5: Guttman scale Items in a Guttman scale gradually increase in specificity. The respondent will agree with items up to a point. Responses can be dichotomous or Likert-type. Again judges will rate and subsequently one sorts the statements and judges agreeing, and select from that pool.

Example 6: Sleep-wake Diary (Carskadon, Acebo, Manber 1992)

Example 7: Please indicate with a cross on the line how sleepy your child currently is
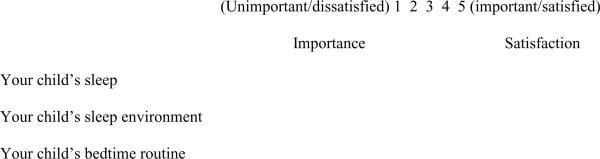
Example 8: Indicate below how important and how satisfied you are with

Box 1: The importance of response categories with respect to the validity and reliability of tools.(3) Left: Printed from Lozano et al (3) the interrelation between number of response categories (here: number of alternatives: 2 – 9) and sample size in relation to Cronbach alpha (α). From the graph it is clear that reliability of the unidimensional scale decreases with fewer responses; i.e., fewer responses decreases the variability and as such the reliability (here expressed by Cronbach alpha). The percentage of variance explained by the first factor decreases as the number of responses is reduced, regardless of the correlations between the items and sample size.(3) This might be extrapolated to multiple dimensions or factors. Right: Hypothetical visualization of the `perceived' range of response (never to always/often/usually) with number of response categories.(40, 41) The fewer response categories, the more forced a choice might `sense'. In addition, assigning a label and a numerical value influences the psychometrics of a tool (e.g., the perceived range, the summated score – e.g., a zero). For instance, the label might blur the hypothetical equal spacing; when 3 responses are given `poor' – `good' – `very good' the differentiation between good and very good might not always be clear-cut, for example respondents circling both (possible solution: replace `very good' by `excellent'). Another example, `often', `occasional' and `sometimes' might have a different value (interpretation) from person to person, or even culturally (e.g., add the frequency when possible to avoid misperception and thus inaccurate responses). With hypothetically equal spacing (or perceived value) among responses `sometimes'(*) would fall in the middle, but depending on the perception of the labels or the assigned numerical value substantial shifts might occur; i.e., horizontally being less or more distinctive, and vertically being gradual or abrupt. It is of utmost importance that each person in each study perceives the responses in identical ways. An analogy would be a grade at school; i.e., mathematical they are at equal distance but some might perceive a 7 closer to 8 and 9, whereas other see it more towards 6, or the difference between a 6 and 7 on a 10 point grade might be perceived large whereas on a 20 point grade it might be perceived small. A: 7-point scale from 1–7 with 1: never, 2: rarely, 3: occasionally, 4: sometimes*, 5: often, 6: almost always, and 7: always. B: 5-point scale from 1 – 5 with 1: never, 2: just a few times, 3: sometimes*, 4: quite often, and 5: always. C: 5-point scale from 0 – 4 with 0: never, 1: just a few times, 2: sometimes*, 3: quite often, and 4: always. D: 5-point scale from 0 – 3 with 0: never, 0: rarely, 1: occasionally*, 2: often, and 3: very often. E: 3-point scale from 1 – 3 with 1: never/rarely, 2: sometimes*, and 3: usually. F: 3-point scale from 0 – 2 with 0: never/rarely, 1: sometimes*, and 2: usually.
References
-
- Baker LW. SLEEP. Journal of Education. 1884;20(18):2393–293.
-
- Cohen L, Mannion L. Research Methods in Education. 2nd ed Croom Helm; New Hampshire: 1985.
-
- Lozano LM, GarcÃ-a-Cueto E, Muñiz J. Effect of the number of response categories on the reliability and validity of rating scales. Methodology. 2008;4(2):73–9.
-
- Montgomery-Downs HE, O'Brien LM, Holbrook CR, Gozal D. Snoring and sleep-disordered breathing in young children: Subjective and objective correlates. Sleep. 2004;27(1):87–94. - PubMed
-
- Rothman KJ, Greenland S. Modern Epidemiology. Lippincott-Raven; Philapdelphia: 1998.
