. 2010 Dec 17;285(51):39691-701.
doi: 10.1074/jbc.M110.180695. Epub 2010 Oct 15.

C1q/TNF-related protein-3 (CTRP3), a novel adipokine that regulates hepatic glucose output

Affiliations

C1q/TNF-related protein-3 (CTRP3), a novel adipokine that regulates hepatic glucose output

Jonathan M Peterson et al. J Biol Chem. .

Abstract

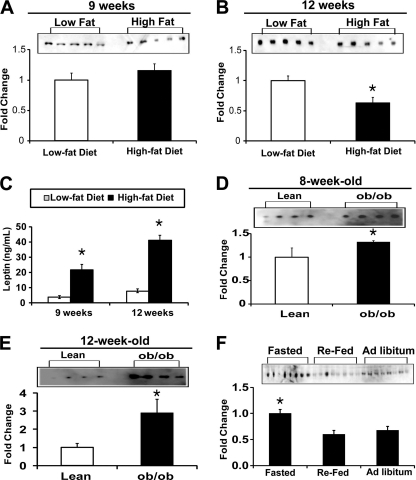
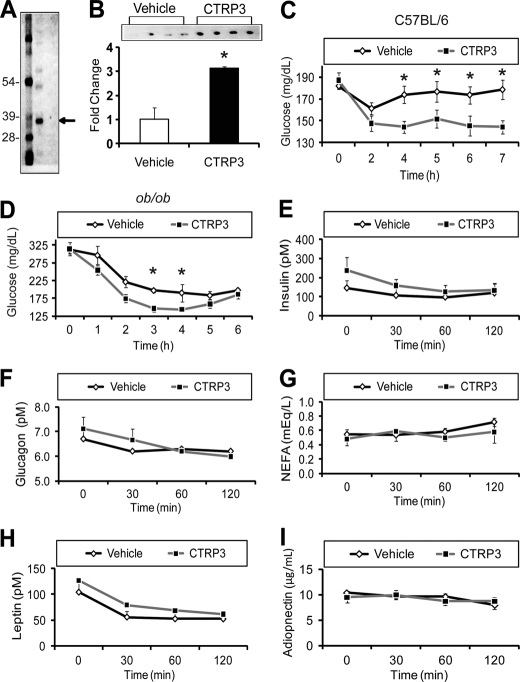
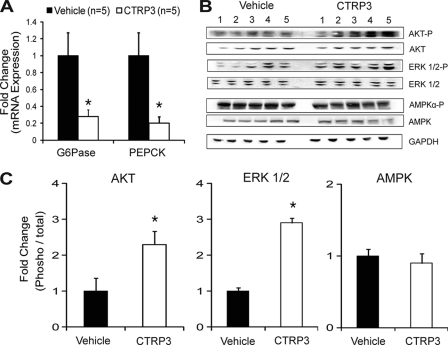
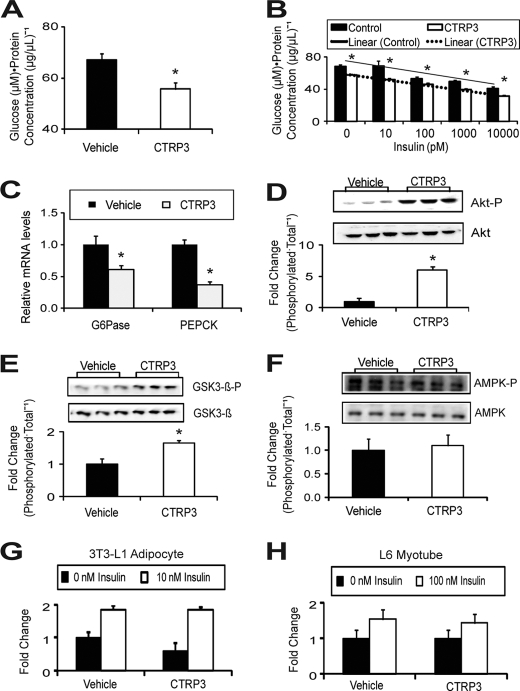
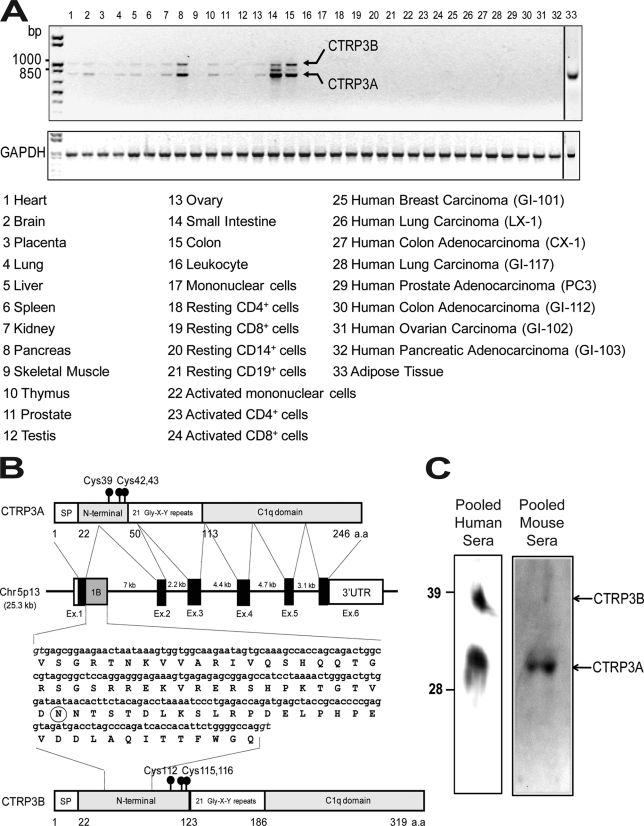
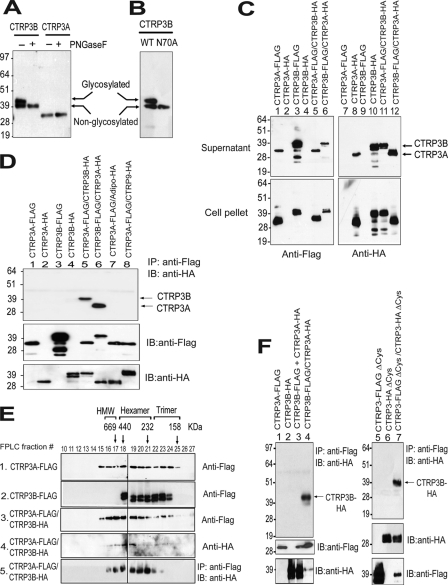
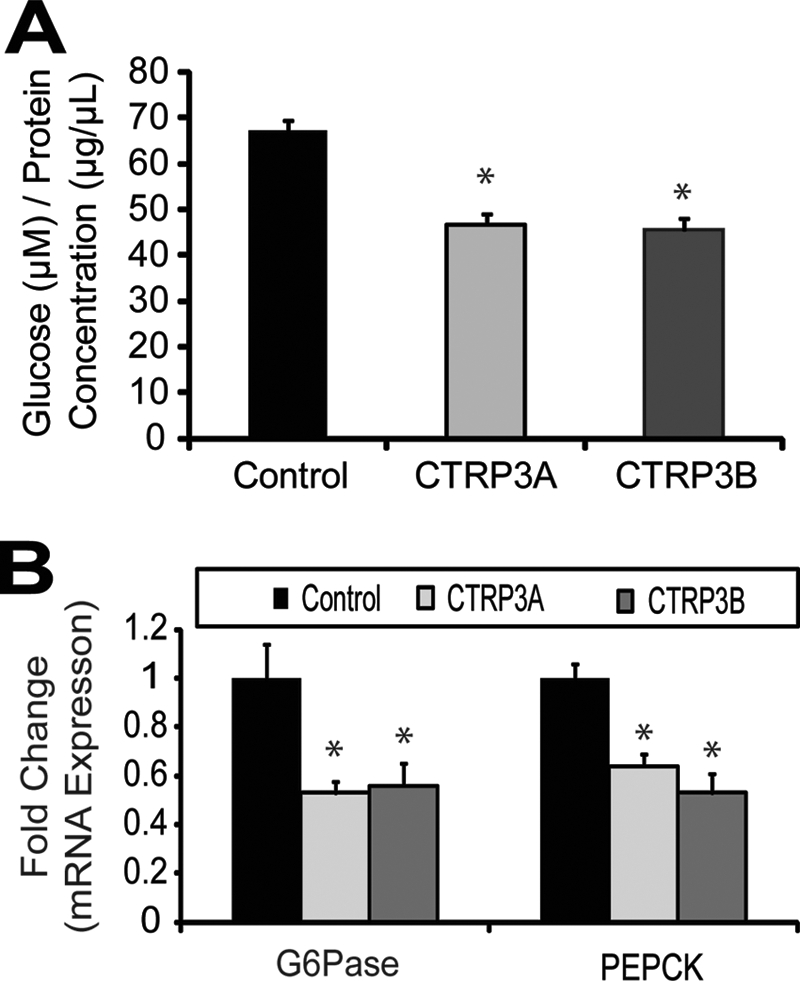
Adipose tissue-derived adipokines play important roles in controlling systemic insulin sensitivity and energy balance. Our recent efforts to identify novel metabolic mediators produced by adipose tissue have led to the discovery of a highly conserved family of secreted proteins, designated as C1q/TNF-related proteins 1-10 (CTRP1 to -10). However, physiological functions regulated by CTRPs are largely unknown. Here we provide the first in vivo functional characterization of CTRP3. We show that circulating levels of CTRP3 are inversely correlated with leptin levels; CTRP3 increases with fasting, decreases in diet-induced obese mice with high leptin levels, and increases in leptin-deficient ob/ob mice. A modest 3-fold elevation of plasma CTRP3 levels by recombinant protein administration is sufficient to lower glucose levels in normal and insulin-resistant ob/ob mice, without altering insulin or adiponectin levels. The glucose-lowering effect in mice is linked to activation of the Akt signaling pathway in liver and a marked suppression of hepatic gluconeogenic gene expression. Consistent with its effects in mice, CTRP3 acts directly and independently of insulin to regulate gluconeogenesis in cultured hepatocytes. In humans, alternative splicing generates two circulating CTRP3 isoforms differing in size and glycosylation pattern. The two human proteins form hetero-oligomers, an association that does not require interdisulfide bond formation and appears to protect the longer isoform from proteolytic cleavage. Recombinant human CTRP3 also reduces glucose output in hepatocytes by suppressing gluconeogenic enzyme expression. This study provides the first functional evidence linking CTRP3 to hepatic glucose metabolism and establishes CTRP3 as a novel adipokine.


Figures

FIGURE 1.
FIGURE 1.
Circulating levels of CTRP3. The CTRP3 immunoblot of sera from mice on either a high fat or low fat diet shows no change after 9 weeks (A) but significant reduction of CTRP3 after 12 weeks (B). Mice on a high fat diet had significantly elevated leptin levels (C). The immunoblot of sera from leptin-deficient obese (ob/ob) mice showed increased concentration of CTRP3 at 8 weeks (D) and 12 weeks (E) of age, compared with the lean phenotype. F, immunoblot of sera for circulating CTRP3 levels in fasted, refed, and ad libitum-fed mice. Each bar represents the mean ± S.E. (error bars) (n = 4–8). *, p < 0.05.
FIGURE 2.
FIGURE 2.
CTRP3 administration decreases blood glucose in mice. Injection of mice with 2 μg/g body weight of purified recombinant CTRP3 (A) increased circulating CTRP3 levels 3-fold (B) and was sufficient to lower blood glucose in normal C57BL/6 (C) and obese and diabetic (ob/ob) mice (D) without altering serum insulin, glucagon, non-esterified fatty acids (NEFA), leptin, or adiponectin levels (E–I). Each bar represents the mean ± S.E. (error bars) (n = 8). *, p < 0.05.
FIGURE 3.
FIGURE 3.
CTRP3 administration suppresses hepatic gluconeogenic gene expression. Injection of mice with 2 μg/g body weight of recombinant CTRP3 suppressed the expression of gluconeogenic genes PEPCK and G6Pase in mouse liver, as assessed by quantitative real-time PCR analysis (A). Administration of recombinant CTRP3 to mice increased Akt and Erk1/2 phosphorylation in liver with no change in AMPKα phosphorylation (B and C). Each bar represents the mean ± S.E. (error bars) (n = 5). *, p < 0.05.
FIGURE 4.
FIGURE 4.
CTRP3 acts directly on liver cells, independent of insulin, to suppress gluconeogenic gene expression and glucose production. Gluconeogenesis was reduced in rat H4IIE hepatoma cells treated with recombinant CTRP3 (n = 6) for 16 h (A); this effect was independent of insulin concentration (n = 6) (B). Recombinant CTRP3 suppressed the expression of gluconeogenic genes PEPCK and G6Pase in hepatoma cells (n = 6) (C). Additionally, CTRP3 treatment increased Akt (D) and GSK3-β (E) phosphorylation but not AMPKα (F) in hepatoma cells. Treatment with recombinant CTRP3 in the absence or presence of insulin (10 nm) resulted in no change in glucose uptake in 3T3-L1 adipocytes (G) and rat L6 myotubes (H). In all experiments, cells were treated with 5 μg/ml recombinant CTRP3. All in vitro signaling experiments have been repeated at least twice, and comparable results were obtained. Each bar represents the mean ± S.E. (error bars). *, p < 0.05.
FIGURE 5.
FIGURE 5.
Identification of a novel splice variant of CTRP3 in human tissues. A semiquantitative PCR analysis was carried out to evaluate the expression of CTRP3 and control GAPDH in human tissues (A). Two splice variants were identified and designated as CTRP3A and CTRP3B. B, organization of the CTRP3A and CTRP3B genes and proteins. The human CTRP3A gene is 25.3 kb in size, consists of six exons and five introns, and is located on chromosome 5p13. Exons 1, 2, 3, 4, 5, and 6 of the CTRP3A gene are 171, 112, 155, 130, 100, and 2,885 bp in size, respectively. The size of each intron is also indicated. Exon 1B (gray square) contains a 219-nucleotide sequence found in CTRP3B cDNA, coding for an extra 73 amino acid residues. A potential N-linked glycosylation site is circled. The consensus splice donors are shown in italic type. C, pooled human and mouse sera were subjected to immunoblot analysis using the anti-CTRP3 antibody.
FIGURE 6.
FIGURE 6.
Human CTRP3A forms hetero-oligomers with CTRP3B, protecting CTRP3B from proteolytic cleavage. A, immunoblot analysis was carried out on conditioned media containing FLAG-tagged CTRP3A or CTRP3B incubated with (+) or without (−) peptide:N-glycosidase F (PNGaseF) to determine the presence of N-linked glycans. B, conditioned media containing FLAG-tagged wild-type (WT) and mutant (N70A) CTRP3B were subjected to immunoblot analysis. C, supernatant and cell lysate containing epitope-tagged CTRP3A and/or CTRP3B were subjected to immunoblot analysis. D, secreted epitope-tagged CTRP3A and/or CTRP3B were immunoprecipitated (IP) with the anti-FLAG affinity gel and immunoblotted (IB) with the anti-HA antibody. E, size exclusion chromatographic (FPLC) analysis of secreted epitope-tagged CTRP3A and/or CTRP3B. Fractions 10–27 were subjected to immunoblot analysis (panels 1–4). Additionally, fractions 10–27 were immunoprecipitated with the anti-FLAG affinity gel and immunoblotted with the anti-HA antibody (panel 5). The indicated molecular weight markers (669, 440, 232, and 158 kDa) correspond to the peak elution fraction of molecular standard thyroglobulin, ferritin, catalase, and aldolase, respectively. FPLC fractions that correspond to adiponectin trimers, hexamers, and high molecular weight oligomers are indicated. F, co-expressed proteins (lane 4) or a mixture of separately expressed protein (lane 3) were immunoprecipitated with the anti-FLAG affinity gel and immunoblotted with the anti-HA antibody (top). Replicate blots were probed for the presence of epitope-tagged input proteins. The cysteine mutant of CTRP3A and/or CTRP3B (lanes 5–7) were immunoprecipitated with the anti-FLAG affinity gel and immunoblotted with the anti-HA antibody (top). Replicate blots were probed for the presence of epitope-tagged input proteins.
FIGURE 7.
FIGURE 7.
Human CTRP3A or CTRP3B suppresses gluconeogenesis in vitro. Glucose production was reduced in rat H4IIE hepatoma cells treated with 5 μg/ml recombinant human CTRP3A or CTRP3B for 16 h (A). Human CTRP3 treatment also suppressed the expression of gluconeogenic genes PEPCK and G6Pase (B). Each bar represents the mean ± S.E. (error bars) (n = 5). *, p < 0.05.

References

    1. Scherer P. E. (2006) Diabetes 55, 1537–1545 - PubMed
    1. Zhang Y., Proenca R., Maffei M., Barone M., Leopold L., Friedman J. M. (1994) Nature 372, 425–432 - PubMed
    1. Scherer P. E., Williams S., Fogliano M., Baldini G., Lodish H. F. (1995) J. Biol. Chem. 270, 26746–26749 - PubMed
    1. Steppan C. M., Bailey S. T., Bhat S., Brown E. J., Banerjee R. R., Wright C. M., Patel H. R., Ahima R. S., Lazar M. A. (2001) Nature 409, 307–312 - PubMed
    1. Yang Q., Graham T. E., Mody N., Preitner F., Peroni O. D., Zabolotny J. M., Kotani K., Quadro L., Kahn B. B. (2005) Nature 436, 356–362 - PubMed

Publication types

MeSH terms

Associated data