. 2010 Dec 24;285(52):40479-88.
doi: 10.1074/jbc.M110.155267. Epub 2010 Oct 14.

Substrate channeling in mammalian base excision repair pathways: passing the baton

Affiliations

Substrate channeling in mammalian base excision repair pathways: passing the baton

Rajendra Prasad et al. J Biol Chem. .

Abstract

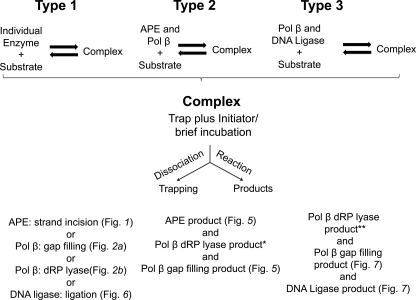
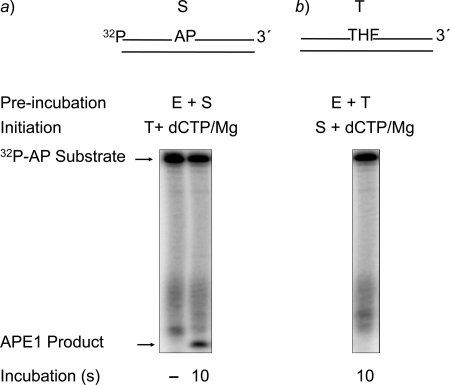
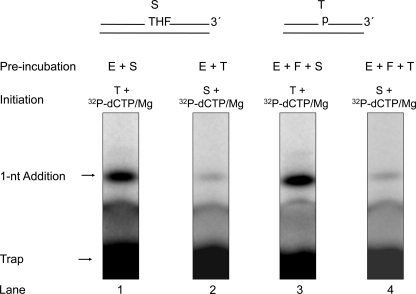
The current model for base excision repair (BER) involves two general sub-pathways termed single-nucleotide BER and long patch BER that are distinguished by their repair patch sizes and the enzymes/co-factors involved. Both sub-pathways involve a series of sequential steps from initiation to completion of repair. The BER sub-pathways are designed to sequester the various intermediates, passing them along from one step to the next without allowing these toxic molecules to trigger cell cycle arrest, necrotic cell death, or apoptosis. Although a variety of DNA-protein and protein-protein interactions are known for the BER intermediates and enzymes/co-factors, the molecular mechanisms accounting for step-to-step coordination are not well understood. In the present study we designed an in vitro assay to explore the question of whether there is a channeling or "hand-off" of the repair intermediates during BER in vitro. The results show that when BER enzymes are pre-bound to the initial single-nucleotide BER intermediate, the DNA is channeled from apurinic/apyrimidinic endonuclease 1 to DNA polymerase β and then to DNA ligase. In the long patch BER subpathway, where the 5'-end of the incised strand is blocked, the intermediate after DNA polymerase β gap filling is not channeled to the subsequent enzyme, flap endonuclease 1. Instead, flap endonuclease 1 must recognize and bind to the intermediate in competition with other molecules.


Figures

SCHEME 1.
SCHEME 1.
Illustration of different types of incubation protocols used in the single turnover experiments to examine substrate channeling during SN BER. Purified human BER enzymes were preincubated with substrates either individually (Type 1) or as mixtures of enzymes (Types 2 and 3). The enzyme-substrate complexes formed during the preincubation were then mixed with a DNA trap plus initiator of the individual reaction. The trap was designed to remove any unbound free enzyme left in solution after the preincubation along with any enzyme that might dissociate from the complex after initiation of the reaction. After addition of the trap and initiator, reaction mixtures were incubated for 10 s. In the type 3 incubation, 32P-labeled dNTP was the labeled substrate, whereas in types 1 and 2 incubations 32P-labeled substrate DNA was used; the asterisks indicate that the respective products were not measured. Figures illustrating the corresponding results are designated.
FIGURE 1.
FIGURE 1.
Incision of the AP site-containing DNA by APE1 in the presence of a DNA trap. Schematic representations of 5′-end 32P-labeled AP site-containing DNA substrate (S) and DNA trap (T) are illustrated above the phosphorimage of the gels. The incision activity APE1 in the presence of a DNA trap was examined as described in detail under “Experimental Procedures.” The reaction mixture was assembled on ice either with 30 nm APE1 and 10 nm 32P-labeled UDG-treated DNA (a) or with APE1 and DNA trap (b). Reactions were then initiated by temperature jump and the addition of a mixture of DNA trap and MgCl2 (a) or with the addition of 32P-labeled UDG-treated DNA and MgCl2 (b), respectively. Samples were withdrawn after 10 s and analyzed. The positions of the 32P-labeled substrate and APE1-incised product are indicated. In a, 22% of the substrate was converted into product.
FIGURE 2.
FIGURE 2.
Gap-filling DNA synthesis and removal of the dRP group by pol β in the presence of a DNA trap. Schematic representations of 32P-labeled DNA substrate (S) and DNA trap (T) are illustrated above the phosphorimage of the gels. E denotes pol β. a, gap-filling DNA synthesis by pol β in the presence of a DNA trap was examined as described under “Experimental Procedures.” The reaction mixture was assembled on ice either with 60 nm pol β and 20 nm 5′-end 32P-labeled UDG/APE1-treated DNA (lanes 1–3) or with pol β and DNA trap (lanes 4 and 5). Reactions were then initiated by temperature jump and the addition of a mixture of dCTP, DNA trap, and MgCl2 (lanes 1–3) or dCTP, 32P-labeled UDG/APE1-treated DNA, and MgCl2 (lanes 4 and 5), respectively. Samples were withdrawn at 10 and 20 s and analyzed. The positions of the 32P-labeled primer and 1-nt gap-filling product are indicated. b, for analyzing the dRP lyase activity of pol β in the presence of a DNA trap, the reaction mixture was assembled on ice with either 60 nm pol β and 20 nm 3′-end 32P-labeled UDG/APE1-treated DNA (lanes 1–3),or pol β and the trap (lanes 4 and 5). Reactions then were initiated by temperature jump and the addition of a DNA trap (lanes 1–3) or 32P-labeled substrate (lanes 4 and 5), respectively. Samples were withdrawn at 10 and 20 s. The reaction products were stabilized by the addition of NaBH4, and the reaction products were analyzed. The positions of the 32P-labeled dRP substrate and the product are indicated. For gap-filling, 25% of the substrate was converted to product, and for dRP lyase, 37% of the substrate was converted to product.
FIGURE 3.
FIGURE 3.
Analysis of gap-filling DNA synthesis and removal of the dRP group steps by pol β simultaneously. Schematic representations of a [32P]DNA substrate labeled at both ends (S) and the DNA trap (T) are illustrated above the phosphorimage of the gels. E denotes pol β. Double-labeled 34-bp DNA was prepared by annealing a 5′-end-labeled 15-mer oligonucleotide and a 3′-end-labeled 19-mer oligonucleotide to their complementary 34-mer DNA strand. The 19-mer oligonucleotide also contained a 5′-end phosphate and uracil. The duplex DNA was pretreated with UDG, resulting in a single-nucleotide gapped DNA with 3′-OH and 5′-dRP groups at the margins and radiolabels on both ends. Gap-filling DNA synthesis and dRP lyase reactions were performed by pol β in the presence of excess DNA trap as described under “Experimental Procedures.” The repair reaction mixture was assembled on ice either with pol β and 32P-labeled substrate (a) or pol β and DNA trap (b). Reactions then were initiated by temperature jump and the addition of a mixture of dCTP, DNA trap, and MgCl2 (a) or dCTP, 32P-labeled substrate DNA, and MgCl2 (b), respectively. Samples were withdrawn at 10 s and then analyzed. The positions of the 32P-labeled primer, 1-nt gap-filling DNA synthesis product, 32P-labeled dRP substrate, and the dRP lyase product are indicated. Product formation corresponded to 25% of the substrate and 46% of the substrate, respectively, for gap-filling DNA synthesis and dRP lyase.
FIGURE 4.
FIGURE 4.
Transient-state kinetic analysis of pol β dRP lyase reaction. Time courses were determined as described under “Experimental Procedures.” a, reactions were initiated by adding enzyme (50 (open), 100 (half-filled), or 150 nm (filled squares)) to 500 nm DNA substrate, and product formation was determined at the indicated time points. b, a shown is a secondary plot of the burst amplitudes (y intercept) determined from an extrapolated linear fit for each enzyme concentration. The solid line is a linear fit of the data with a y intercept of 0 and slope of 0.69 nm product per 1 nm added enzyme. c, shown is a re-plot of the data in panel a normalized for enzyme concentration. Accordingly, the ordinate scale provides the number of enzyme turnovers and indicates that 0.7 nm product is formed during the burst, indicating that ∼70% of the added enzyme is productively bound. The turnover number for the linear phase is 0.12/min. d, single turnover analysis of the dRP lyase reaction is shown. Pol β (1 μm) was rapidly mixed with 200 nm DNA substrate, and time points were collected. The time course exhibits two rapid phases; that is, a fast phase that was too rapid to measure (amplitude ∼ 20 nm) and a slower exponential phase (kobs ∼ 120/min). Both of these phases were considerably more rapid that the linear phase determined in panel c.
FIGURE 5.
FIGURE 5.
Analysis of APE1-incision and gap-filling DNA synthesis steps in combination. Schematic representations of 32P-labeled AP site-containing DNA substrate (S) and DNA trap (T) are illustrated above the phosphorimage of the gels. The incision activity by APE1 and gap-filling DNA synthesis by pol β were examined in the presence of a DNA trap as described under “Experimental Procedures.” The reaction mixture was assembled on ice either with APE1, pol β, and 32P-labeled substrate DNA (a) or with APE1, pol β, and DNA trap (b). Reactions were then initiated by temperature jump and the addition of a mixture of DNA trap and dCTP/MgCl2 (a) or 32P-labeled substrate DNA and dCTP/MgCl2 (b), respectively. Samples were withdrawn at intervals and analyzed. The positions of the 32P-labeled substrate, APE1-incised product, and 1-nt gap-filling product are indicated. The APE1 product and gap-filling product corresponded to conversion of 24 and 9% of the substrate, respectively.
FIGURE 6.
FIGURE 6.
Analysis of the ligation step in the BER scheme conducted by purified DNA ligases. Schematic representations of 32P-labeled nicked DNA substrate (S) and the DNA trap (T) are illustrated above the phosphorimage of the gel. The ligation reaction was performed with DNA ligase I (lanes 1–4), DNA ligase III (lanes 5–8), or T4 DNA ligase (lanes 9–12) in the presence of a DNA trap as described under “Experimental Procedures.” The ligation reactions were assembled either with 32P-labeled DNA substrate and a DNA ligase or with DNA trap and a DNA ligase. Reactions were then initiated by temperature jump and the addition of a mixture of ATP, MgCl2, and DNA trap or ATP, MgCl2, and 32P-labeled DNA substrate, as indicated at the top of each lane. Samples were withdrawn at 10- and 20-s intervals and analyzed. The positions of the 32P-labeled primer and ligated product are indicated. L1, L3, and T4 denote DNA ligase I, DNA ligase III, and T4 DNA ligase, respectively.
FIGURE 7.
FIGURE 7.
Analysis of gap-filling, dRP lyase, and ligation steps in combination. Schematic representations of UDG/APE1-treated DNA substrate (S) and the DNA trap (T) are illustrated above the phosphorimage of the gels. A complete BER reaction containing the pretreated DNA substrate or trap DNA, pol β, and DNA ligase I was assembled on ice. The reaction was initiated by a temperature jump and the addition of a mixture of [α-32P]dCTP, MgCl2, ATP, and DNA trap or [α-32P]dCTP, MgCl2, ATP, and DNA substrate as indicated at the top of each lane. Samples were withdrawn at 10 s and then analyzed. The positions of the 1-nt gap-filling product, ligated complete BER product, free trap, and the ligated trap are indicated. E and L denote pol β and DNA ligase I, respectively. In lane 1, the ligated product corresponded to 56% of the 1-nt gap-filling product found in lane 3. A minor amount of gap-filling product was observed in the presence of the trap.
FIGURE 8.
FIGURE 8.
Analysis of the DNA synthesis step in LP BER. Schematic representations of APE1-treated THF-DNA substrate (S), a LP BER intermediate, and the DNA trap (T) are illustrated above the phosphorimage of the gels. E and F denote pol β and FEN1, respectively. DNA synthesis reaction was performed by pol β alone or pol β and FEN1 in the presence of excess DNA trap as described under “Experimental Procedures.” The repair reaction mixture was assembled on ice either with pol β alone (lane 1) and substrate DNA or with pol β and FEN1 (lane 3) and substrate DNA, respectively. The reactions were initiated by a temperature jump and the addition of a mixture of [α-32P]dCTP, dATP, dGTP, TTP, DNA trap, and MgCl2 (lanes 1 and 3). In another set of reaction mixtures, pol β or pol β and FEN1 were mixed with the DNA trap first, and then the reactions were initiated by adding a mixture of [α-32P]dCTP, dATP, dGTP, TTP, substrate DNA, and MgCl2 (lanes 2 and 4), respectively. Reaction mixtures were incubated for 10 s and analyzed. The positions of the 1-nt addition and free trap are indicated.
FIGURE 9.
FIGURE 9.
Analysis of gap-filling, FEN1 cleavage, and ligation steps in LP BER. Schematic representations of APE1-treated THF-DNA substrate (S), LP BER intermediate, and the DNA trap (T) are illustrated above the phosphorimage of the gels. E, F, and L denote pol β, FEN1, and DNA ligase I, respectively. The repair reaction mixture was assembled on ice either with pol β, FEN1 substrate DNA (lane 1), or with pol β, FEN1, DNA ligase I, and substrate DNA (lane 3). The reactions were initiated by a temperature jump and the addition of a mixture of [α-32P]dCTP, dATP, dGTP, TTP, ATP, DNA trap, and MgCl2 (lanes 1 and 3). In another set of reaction mixtures, pol β and FEN1 or pol β, FEN1, and DNA ligase I were preincubated with the DNA trap first, and then the reactions were initiated by adding a mixture of [α-32P]dCTP, dATP, dGTP, TTP, ATP, substrate DNA, and MgCl2 (lanes 2 and 4). Reaction mixtures were incubated for 10 s and analyzed. The positions of 1-nt gap-filling product, ligated BER product, free trap, and the ligated trap are indicated.

Similar articles

Cited by

References

    1. Lindahl T. (1982) Annu. Rev. Biochem. 51, 61–87 - PubMed
    1. Lindahl T. (1993) Nature 362, 709–715 - PubMed
    1. Loeb L. A., Preston B. D. (1986) Annu. Rev. Genet. 20, 201–230 - PubMed
    1. Kubota Y., Nash R. A., Klungland A., Schär P., Barnes D. E., Lindahl T. (1996) EMBO J. 15, 6662–6670 - PMC - PubMed
    1. Wilson S. H. (1998) Mutat. Res. 407, 203–215 - PubMed

Publication types

LinkOut - more resources