

Temperature dependence of DNA persistence length
- PMID: 20952402
- PMCID: PMC3045604
- DOI: 10.1093/nar/gkq932
Temperature dependence of DNA persistence length
Abstract
We have determined the temperature dependence of DNA persistence length, a, using two different methods. The first approach was based on measuring the j-factors of short DNA fragments at various temperatures. Fitting the measured j-factors by the theoretical equation allowed us to obtain the values of a for temperatures between 5°C and 42°C. The second approach was based on measuring the equilibrium distribution of the linking number between the strands of circular DNA at different temperatures. The major contribution into the distribution variance comes from the fluctuations of DNA writhe in the nicked circular molecules which are specified by the value of a. The computation-based analysis of the measured variances was used to obtain the values of a for temperatures up to 60°C. We found a good agreement between the results obtained by these two methods. Our data show that DNA persistence length strongly depends on temperature and accounting for this dependence is important in quantitative comparison between experimental results obtained at different temperatures.
Figures
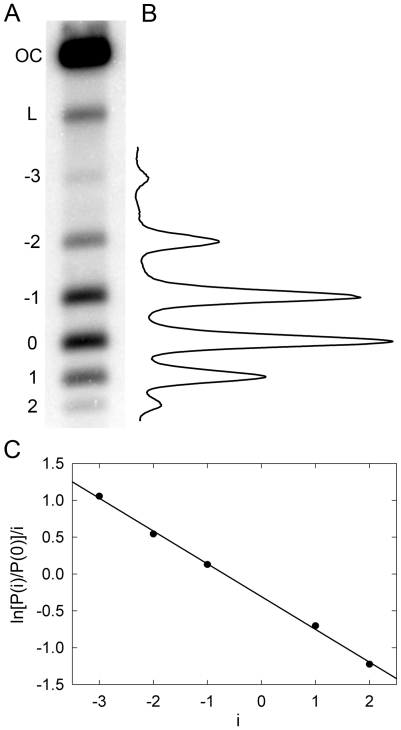
 . To analyze the distribution, radioactively labeled DNA topoisomers were separated by agarose gel electrophoresis (A) and the gel was scanned by Phosphorimager (B). The symbols OC and L mark the bands of open circular and linear DNA molecules, correspondingly. (C) Linearized representation of the distribution. The slope of the line on the plot is specified by the distribution variance (see text for details).
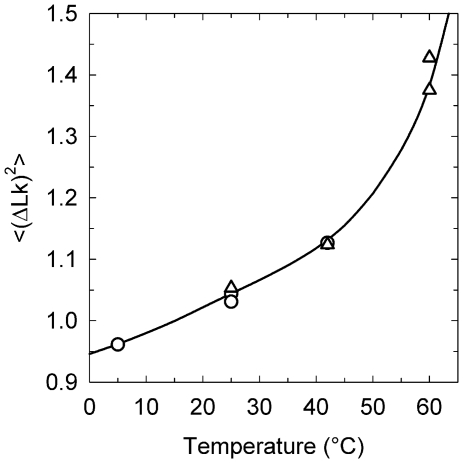
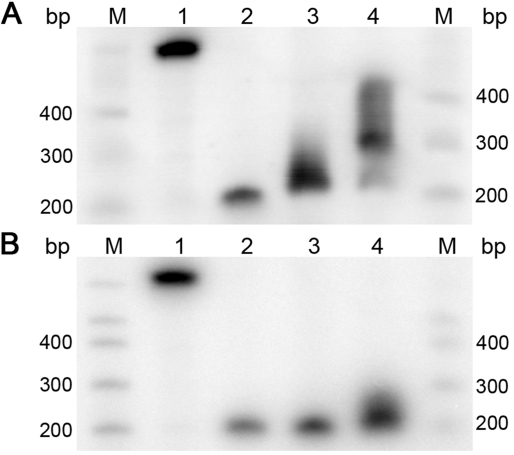
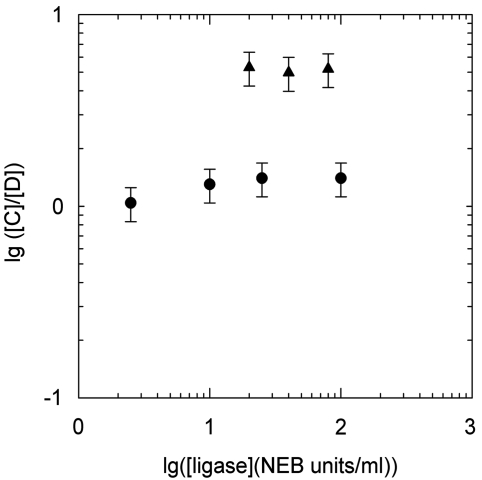
 . The distributions of the topoisomers were obtained by applying T4 DNA ligase (open circle) or Taq DNA ligase (open triangle) to nicked samples of pUC19 plasmid.
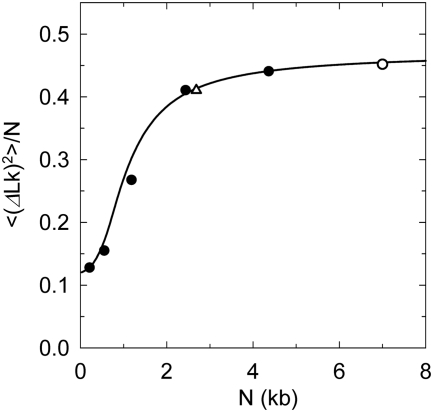
 . Experimental data (filled circle) for 37°C were taken from reference (25). The data from the current study (open triangle) and from reference (33) (open circle) were adjusted to 37°C according to the temperature dependence of
  presented in Figure 5. The line represents the best theoretical fit of the data. The shown curve corresponds to C of 3.1 × 10⁻¹⁹ erg ·cm, a of 45 nm and DNA effective diameter of 5 nm (33), in very good agreement with other available data.
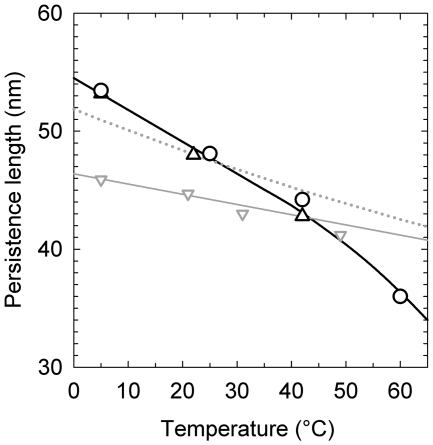
 (open circle) in the current study are shown together with Equation (1) (dotted gray line) and the data from reference (12). The solid line represents manual interpolation of the current results.
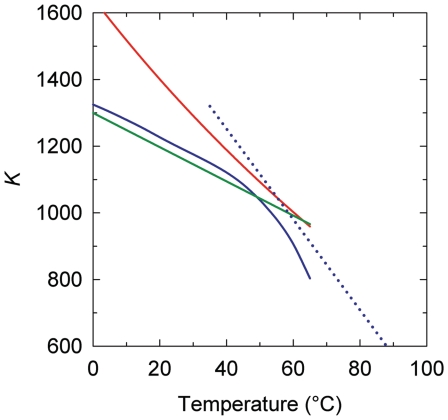
 . The shown data represent temperature dependence of K that specifies
  according to Equation (6). The lines correspond to the data obtained in the current study (blue solid line), references (42) (green line), (43) (red line) and (44) (dotted blue line).
Similar articles
-
Sequence dependence of DNA bending rigidity.Proc Natl Acad Sci U S A. 2010 Aug 31;107(35):15421-6. doi: 10.1073/pnas.1004809107. Epub 2010 Aug 11. Proc Natl Acad Sci U S A. 2010. PMID: 20702767 Free PMC article.
-
The twist, writhe, and linking number distributions in closed circular DNA.J Biomol Struct Dyn. 1985 Oct;3(2):315-25. doi: 10.1080/07391102.1985.10508419. J Biomol Struct Dyn. 1985. PMID: 3917023
-
Application of the method of phage T4 DNA ligase-catalyzed ring-closure to the study of DNA structure. I. Computational analysis.J Mol Biol. 1990 Mar 20;212(2):351-62. doi: 10.1016/0022-2836(90)90130-E. J Mol Biol. 1990. PMID: 2319603
-
[Distributions of circular DNA according its topological states].Mol Biol (Mosk). 2001 Mar-Apr;35(2):285-97. Mol Biol (Mosk). 2001. PMID: 11357411 Review. Russian.
-
Toward improved biochips based on rolling circle amplification--influences of the microenvironment on the fluorescence properties of labeled DNA oligonucleotides.Ann N Y Acad Sci. 2008;1130:287-92. doi: 10.1196/annals.1430.022. Ann N Y Acad Sci. 2008. PMID: 18596361 Review.
Cited by
-
How does temperature impact the conformation of single DNA molecules below melting temperature?Nucleic Acids Res. 2018 Feb 28;46(4):2074-2081. doi: 10.1093/nar/gkx1285. Nucleic Acids Res. 2018. PMID: 29294104 Free PMC article.
-
DNA structure at the plasmid origin-of-transfer indicates its potential transfer range.Sci Rep. 2018 Jan 29;8(1):1820. doi: 10.1038/s41598-018-20157-y. Sci Rep. 2018. PMID: 29379098 Free PMC article.
-
Solid-to-fluid DNA transition inside HSV-1 capsid close to the temperature of infection.Nat Chem Biol. 2014 Oct;10(10):861-7. doi: 10.1038/nchembio.1628. Epub 2014 Sep 7. Nat Chem Biol. 2014. PMID: 25195012 Free PMC article.
-
Plasmon Rulers as a Probe for Real-Time Microsecond Conformational Dynamics of Single Molecules.Nano Lett. 2018 Dec 12;18(12):7927-7934. doi: 10.1021/acs.nanolett.8b03860. Epub 2018 Nov 26. Nano Lett. 2018. PMID: 30423246 Free PMC article.
-
Temperature and pH dependence of DNA ejection from archaeal lemon-shaped virus His1.Eur Biophys J. 2016 Jul;45(5):435-42. doi: 10.1007/s00249-016-1112-7. Epub 2016 Jan 28. Eur Biophys J. 2016. PMID: 26820561
References
-
- Bustamante C., Bryant Z., Smith S.B. Ten years of tension: single-molecule DNA mechanics. Nature. 2003;421:423–427. - PubMed
-
- Allemand J.F., Bensimon D., Croquette V. Stretching DNA and RNA to probe their interactions with proteins. Curr. Opin. Struct. Biol. 2003;13:266–274. - PubMed
-
- Hagerman P.J. Flexibility of DNA. Ann. Rev. Biophys. Biophys. Chem. 1988;17:265–286. - PubMed
Publication types
MeSH terms
Substances
Grants and funding
LinkOut - more resources
Full Text Sources
Other Literature Sources
