. 2011 Mar;39(6):1993-2006.
doi: 10.1093/nar/gkq864. Epub 2010 Oct 15.

Chromatin and DNA methylation dynamics during retinoic acid-induced RET gene transcriptional activation in neuroblastoma cells

Affiliations

Chromatin and DNA methylation dynamics during retinoic acid-induced RET gene transcriptional activation in neuroblastoma cells

T Angrisano et al. Nucleic Acids Res. 2011 Mar.

Abstract

Although it is well known that RET gene is strongly activated by retinoic acid (RA) in neuroblastoma cells, the mechanisms underlying such activation are still poorly understood. Here we show that a complex series of molecular events, that include modifications of both chromatin and DNA methylation state, accompany RA-mediated RET activation. Our results indicate that the primary epigenetic determinants of RA-induced RET activation differ between enhancer and promoter regions. At promoter region, the main mark of RET activation was the increase of H3K4me3 levels while no significant changes of the methylation state of H3K27 and H3K9 were observed. At RET enhancer region a bipartite chromatin domain was detected in unstimulated cells and a prompt demethylation of H3K27me3 marked RET gene activation upon RA exposure. Moreover, ChIP experiments demonstrated that EZH2 and MeCP2 repressor complexes were associated to the heavily methylated enhancer region in the absence of RA while both complexes were displaced during RA stimulation. Finally, our data show that a demethylation of a specific CpG site at the enhancer region could favor the displacement of MeCP2 from the heavily methylated RET enhancer region providing a novel potential mechanism for transcriptional regulation of methylated RA-regulated loci.


Figures
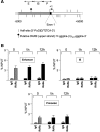
Figure 1.
Figure 1.
RARα association to RET gene regulatory regions. (A) Bioinformatical analysis. In the aim to find putative RARE we performed the analysis on both forward and reverse strand of the genomic region located between −5000 to +5000 nt positions with respect of RET trascriptional start site. We searched for all 5′-PuG[G/T]TCA-3′ motifs (half-sites) and considered only exact directly repeated half-sites separated by up to 150 nt as potential RARE sites. With these criteria only one putative RARE was identified on the forward strand, at position from −3178 to −3046, as indicated in the figure. E, Enhancer region; I, intervening sequences; P, Promoter region. (B) SK-N-BE cells were treated for 1 or 12 h with 10 µM RA or were left untreated (Time 0). ChIP experiments were performed with anti-RARα antibodies or with IgG (as negative control) and with region-specific primers (EQF and EQR for enhancer; IQF and IQR for IS; PQF and PQR for promoter). Primers to RAREs of human RARB and primers to exon 2 of the same gene were used as positive and negative controls, respectively. RARα levels at RARB RARE was about 30 times the level of association detected at RARB exon 2 (data not shown). Each experiment was repeated at least three times, and the quantitative PCR analyses were performed in triplicate. The data are presented as percentages of input DNA (mean ± SE).
Figure 2.
Figure 2.
Transcriptional assays for RA responsiveness. (A) The region containing RET enhancer, intervening sequence and promoter (3.4 Kb) was amplified and cloned into pGL3-basic Luciferase Vector (pEISP-RET). Right panel: Relative Luciferase Assay results on SK-N-BE cells transfected with 200 μg of corresponding construct represented in the left panel. Plasmid constructs are described in ‘Materials and Methods’ section. (B) A 150-bp fragment including the putative RARE sequence identified on the basis of bioinformatic analysis was cloned both as wild-type (pRARE-wt) and in a mutated form (pRARE-Mut) in a pGL3-promoter Luciferase Vector. Two hundred micrograms of three different constructs were transfected into SK-N-BE cells (left panel): pGL3-promoter Luciferase Vector (empty); pGL3-promoter Luciferase Vector containing the putative RARE and pGL3-promoter Luciferase Vector containing the putative RARE lacking the triplette TCA in both DRs. Plasmid constructs are described in details in ‘Materials and Methods’ section. After transfection, cells were treated with RA (10 μM) for different times followed by luciferase activity determination. All tranfections were performed in triplicate; luciferase activity was detected 0, 6 and 12 h after RA exposure. Data are means ± SD of three independent experiments. E, Enhancer; IS, Intervening Sequences; P, Promoter; *P < 0.01; **P < 0.05.
Figure 3.
Figure 3.
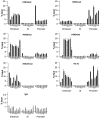
Dynamics of RA-dependent chromatin modifications at RET gene regulatory regions. SK-N-BE cells were treated for the indicated times with 10 µM RA and then cells were fixed with formaldehyde and processed into soluble chromatin. Chromatin samples were immunoprecipitated with the indicated antibodies and bound DNA was quantitated by real time PCR. Each experiment was repeated, starting with cell culture, at least three times, and the quantitative PCR analyses were performed in triplicate. The data are presented as percentages of input DNA (mean ± SE).
Figure 4.
Figure 4.
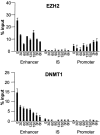
EZH2 and DNMT1 binding to RET regulatory regions. SK-N-BE cells were treated for the indicated times with 10 µM RA. ChIP experiments were performed using anti-EZH2 and anti-DNMT1 antibodies and bound DNA was quantitated by real time PCR. Data, presented as percentages of input DNA before immunoprecipitation, represent the results of three independent experiments ± SEMs.
Figure 5.
Figure 5.
Methylation analysis of RET enhancer and promoter regions in SK-N-BE cells, human normal thyroid tissue and medullary carcinomas. (A) Schematic representation of CpG distribution at RET regulatory regions. Each vertical bar indicates the relative position of a CpG site. Transcription start site is indicated (+1). The specific regions analyzed for DNA methylation state are indicated by horizontal bars. Primers used for enhancer (EbiF and EbiR) and promoter (PbiF and PbiR) methylation analysis are reported in ‘Materials and Methods’ section. (B) DNA methylation patterns in individual PCR clones from the RET enhancer and promoter. All the sequenced molecules from SK-N-BE cells are shown. Numbers on top show the location of CpG dinucleotides. Black circles indicate that the corresponding cytosines are methylated. (C) Percentage of DNA methylation at individual CpG sites in the RET gene enhancer (left panel) and promoter (right panel) in SK-N-BE cells, human normal thyroid tissue (thyroid) and medullary thyroid carcinoma (MTC). Data, from the sequence analysis of least 20 plasmid clones for each sample, were compiled by individual CpG dinucleotides and expressed as the ratio of methyl-C to the number of clones. Positions of CpG sites relative to transcription initiation site are given below the bars.
Figure 6.
Figure 6.
Association of MeCP2 repression complex with RET gene regulatory regions. SK-N-BE cells were treated for the indicated times with 10 µM RA. ChIP experiments were performed using anti-MeCP2 (A), anti HDAC1 (B) and anti mSin3A (C) antibodies. Bound DNAs were quantitated by real time PCR. Data, presented as percentages of input DNA before immunoprecipitation, represent the results of three independent experiments ± standard error of the means.
Figure 7.
Figure 7.
Demethylation of a specific CpG site at RET gene enhancer region upon RA treatment. (A) Schematic representation of CpG distribution at RET enhancer. Each vertical bar indicates the relative position of a CpG site. The approximate position of the primers utilized for bisufite, MassARRAY and pyrosequencing quantitative methylation analyses are indicated (see ‘Materials and Methods’ section for primer specifications). Numbering is referred to TSS. (B) SK-N-BE cells were left untreated (UN) or treated with RA for the indicated times and then methylation analyses were performed on bisulfite treated genomic DNA. Data shown represent the results of three independent methods for quantitative methylation analyses (bisulfite, manual genomic sequencing; Sequenom MassARRAY quantitative methylation analysis; Pyrosequencing quantitative methylation analysis). For manual genomic sequencing, data, from the sequence analysis of at least 20 plasmid clones for each sample, were compiled by individual CpG dinucleotides and expressed as the ratio of methyl-C to the number of clones. Further details for Sequenom MassARRAY and pyrosequencing are reported in ‘Materials and Methods’ section. The results for three CpG sites including the −3375 and adjacent CpG sites, according the three different procedures, are shown as percentage of DNA methylation at individual CpG sites in the RET gene enhancer. (C) ChIP followed by bisulfite analysis (ChIP-BA). SK-N-BE cells were treated with RA for 3 h (3 h) or left untreated (UN) and then ChIPs were performed using anti-MeCP2 antibodies. Input and immunoprecipitated DNAs were subjected to genomic sequencing bisulfite methylation analysis using EBiF and EbiR2 primers (see ‘Materials and Methods’ section). Data were from the sequence analysis of at least 20 plasmid clones for each sample and expressed as the ratio of methyl-C to the number of clones. Shown are the percentages of methylation of three CpG sites.
Figure 8.
Figure 8.
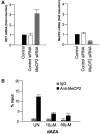
MeCP2 contribution to RET gene silencing. (A) MeCP2 knock-down. SK-N-BE cells were transfected with MeCP2 or a negative control siRNA and after 48 h the RET and MeCP2 mRNA levels were analyzed by RT–PCR. Results are expressed as fold induction compared with control untransfected cells (Control). The experiments were repeated three times and quantitative PCR analyses were performed in triplicates. Error bars represent standard deviation. (B) Effects of 5-aza-2-deoxyazacytidine on MeCP2 binding to RET enhancer. SK-N-BE cells were treated with 5-aza-2-deoxyazacytidine (dAZA) for 48 h at the indicated concentrations and were immunoprecipitated with anti-MeCP2 antibodies (black bar). Anti-IgG were used as a negative control (gray bar). The MeCP2 binding to RET enhancer was quantitated by real-time PCR. Data, presented as percentages of input DNA, represent the results of three independent experiments ± standard error of the means.

Similar articles

Cited by

References

    1. Duester G. Retinoic acid synthesis and signaling during early organogenesis. Cell. 2008;134:921–931. - PMC - PubMed
    1. Mark M, Ghyselinck NB, Chambon P. Function of retinoid nuclear receptors: lessons from genetic and pharmacological dissections of the retinoic acid signaling pathway during mouse embryogenesis. Annu. Rev. Pharmacol. Toxicol. 2006;46:451–480. - PubMed
    1. Means AL, Gudas LJ. The roles of retinoids in vertebrate development. Annu. Rev. Biochem. 1995;64:201–233. - PubMed
    1. Mongan NP, Gudas LJ. Diverse actions of retinoid receptors in cancer prevention and treatment. Differentiation. 2007;75:853–870. - PubMed
    1. Germain P, Chambon P, Eichele G, Evans RM, Lazar MA, Leid M, De Lera AR, Lotan R, Mangelsdorf DJ, Gronemeyer H. International Union of Pharmacology. LX. Retinoic Acid Receptors. Pharmacol. Rev. 2006;58:712–725. - PubMed

Publication types

MeSH terms

Substances