Comparative Study
. 2011 Jan;336(1):223-33.
doi: 10.1124/jpet.110.175034. Epub 2010 Oct 15.

The role of the breast cancer resistance protein (ABCG2) in the distribution of sorafenib to the brain

Affiliations
Comparative Study

The role of the breast cancer resistance protein (ABCG2) in the distribution of sorafenib to the brain

Sagar Agarwal et al. J Pharmacol Exp Ther. 2011 Jan.

Abstract

ATP-binding cassette transporters P-glycoprotein (P-gp) and breast cancer resistance protein (BCRP) have been shown to work in concert to restrict brain penetration of several tyrosine kinase inhibitors. It has been reported that P-gp is dominant in limiting transport of many dual P-gp/BCRP substrates across the blood-brain barrier (BBB). This study investigated the influence of P-gp and BCRP on the central nervous system (CNS) penetration of sorafenib, a multitargeted tyrosine kinase inhibitor currently being evaluated in clinical trials for glioma. In vitro studies showed that BCRP has a high affinity for sorafenib. Sorafenib inhibited P-gp, but did not seem to be a P-gp substrate in vitro. CNS distribution studies showed that transport of sorafenib to the brain was restricted because of active efflux at the BBB. The brain-to-plasma equilibrium-distribution coefficient (area under the concentration-time profiles for plasma/area under the concentration-time profiles for brain) was 0.06 in wild-type mice. Steady-state brain-to-plasma concentration ratio of sorafenib was approximately 0.36 ± 0.056 in the Bcrp1(-/-) mice, 0.11 ± 0.021 in the Mdr1a/b(-/-) mice, and 0.91 ± 0.29 in the Mdr1a/b(-/-)Bcrp1(-/-) mice compared with 0.094 ± 0.007 in the wild-type mice. Sorafenib brain-to-plasma ratios increased on coadministration of the dual P-gp/BCRP inhibitor elacridar such that the ratio in wild-type mice (0.76 ± 0.24), Bcrp1(-/-) mice (1.03 ± 0.33), Mdr1a/b(-/-) mice (1.3 ± 0.29), and Mdr1a/b(-/-)Bcrp1(-/-) mice (0.73 ± 0.35) were not significantly different. This study shows that BCRP and P-gp together restrict the brain distribution of sorafenib with BCRP playing a dominant role in the efflux of sorafenib at the BBB. These findings are clinically relevant to chemotherapy in glioma if restricted drug delivery to the invasive tumor cells results in decreased efficacy.


Figures
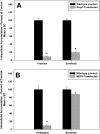
Fig. 1.
Fig. 1.
Intracellular accumulation of [3H]sorafenib in MDCKII cells. A, accumulation in wild-type and Bcrp1-transfected cells. Accumulation of the sorafenib in the Bcrp1-transfected cells (gray bars) was approximately 5-fold lower than that in the wild-type cells (black bars). B, accumulation in wild-type and MDR1-transfected cells. Accumulation of the prototypical substrate vinblastine in the MDR1-transfected cells (gray bars) was approximately 10-fold lower than that in the wild-type cells (black bars). In comparison, no such difference was seen in the accumulation of sorafenib between the two cell types. Mean ± S.D. (n = 6). *, p < 0.05.
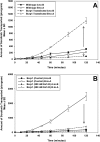
Fig. 2.
Fig. 2.
Directional transport of [3H]sorafenib across MDCKII cell monolayers. A, amount of sorafenib transported across wild-type (●, A-to-B transport; ○, B-to-A transport) and Bcrp1-transfected (▴, A-to-B transport; ▵, B-to-A transport) cells. B, flux of sorafenib in Bcrp1-transfected cells in the presence (●, A-to-B transport; ○, B-to-A transport) and absence (▴, A-to-B transport; ▵, B-to-A transport) of the BCRP inhibitor Ko143. There was significant directionality in transport of sorafenib across Bcrp1 monolayers. This directionality was abolished when cells were treated with 200 nM Ko143. The black arrows indicate the direction of change in sorafenib transport caused by BCRP (A) or addition of Ko143 (B). Mean ± S.D. (n = 6).
Fig. 3.
Fig. 3.
Apparent permeability of [3H]sorafenib across MDCKII wild-type and Bcrp1-transfected cell monolayers. In the Bcrp transfects, the B-to-A permeability (gray bar) was significantly greater than the A-to-B permeability (black bar). Treatment with Ko143 decreased the B-to-A permeability. No difference in apparent permeability was observed in the wild-type cells. Mean ± S.D. (n = 6). *, p < 0.05.
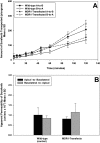
Fig. 4.
Fig. 4.
Directional transport of [3H]sorafenib across MDCKII cell monolayers. A, amount of sorafenib transported across wild-type (●, A-to-B transport; ○, B-to-A transport) and MDR1-transfected (▴, A-to-B transport; ▵, B-to-A transport) cells. B, permeability of [3H]sorafenib across MDCKII wild-type and MDR1-transfected cell monolayers. There was no difference in rate of sorafenib transported and apparent permeability of sorafenib between the A-to-B (black bar) and B-to-A (gray bar) directions, indicating a lack of P-gp mediated efflux. Mean ± S.D. (n = 6).
Fig. 5.
Fig. 5.
Affinity of sorafenib for BCRP. The B-to-A permeability of sorafenib was determined in MDCKII-Bcrp1 cells, with a range of concentrations (0.001 nM to 80 nM) applied to the donor side. A sigmoid inhibitory Emax model was fitted to the data and the affinity constant (Kmapp) was determined to be 5 nM (●, observed data; dashed line, model predicted curve. Mean ± S.D. (n = 3); parameter estimate reported as mean ± S.D. (standard error of the estimate).
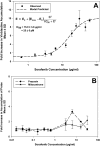
Fig. 6.
Fig. 6.
Inhibition of P-gp and BCRP by sorafenib. A, intracellular accumulation of the P-gp substrate, vinblastine, in MDCKII-MDR1 cells in the presence of increasing sorafenib concentrations. Sorafenib inhibited the accumulation of vinblastine with an IC50 of 25 μM (●, observed data; dashed line, model predicted curve. Mean ± S.D. (n = 4); parameter estimate reported as mean ± S.D. (standard error of the estimate). B, intracellular accumulation of BCRP substrates, prazosin (●) and mitoxantrone (▴) in MDCKII-Bcrp1 cells in the presence of increasing sorafenib concentrations. Sorafenib has no effect on accumulation of the two prototypical BCRP substrates. Mean ± S.D. (n = 4).
Fig. 7.
Fig. 7.
Sorafenib brain and plasma concentrations after a single intravenous dose of 10 mg/kg in FVB wild-type mice. Brain concentrations were significantly lower than the plasma concentrations at all of the measured time points, suggesting limited delivery of sorafenib across the BBB. *, p < 0.05. Mean ± S.D. (n = 4).
Fig. 8.
Fig. 8.
Steady-state brain distribution of sorafenib in wild-type, Mdr1a/b(−/−), Bcrp1(−/−), and Mdr1a/b(−/−)Bcrp1(−/−) mice. Sorafenib was delivered at a constant rate of 2 mg/h/kg, and ratio of the brain and plasma concentrations at steady state (48 h) was determined. The B/P ratio in the Bcrp1(−/−) and Mdr1a/b(−/−)Bcrp1(−/−) mice was significantly greater than that in wild-type mice, suggesting the role of BCRP in efflux of sorafenib at the BBB. *, p < 0.05, compared with wild type; †, p < 0.05, compared with Bcrp1(−/−) mice. Mean ± S.D. (n = 4).
Fig. 9.
Fig. 9.
Influence of the dual inhibitor elacridar on the brain distribution of sorafenib. Elacridar (10 mg/kg i.v.) was given 30 min before the administration of 10 mg/kg sorafenib followed by the determination of brain and plasma concentrations at 60 min. Administration of elacridar increased the B/P ratio in wild-type, Bcrp1(−/−), and Mdr1a/b(−/−) mice such that they were not statistically different from the ratio in the Mdr1a/b(−/−)Bcrp1(−/−) mice. *, p < 0.05, compared with wild-type control; †, p < 0.05, compared with corresponding control; #, no significant difference between the control and vehicle control groups of each genotype. Mean ± S.D. (n = 4).

Similar articles

Cited by

References

    1. Agarwal S, Sane R, Gallardo JL, Ohlfest JR, Elmquist WF. (2010) Distribution of gefitinib to the brain is limited by P-glycoprotein (ABCB1) and breast cancer resistance protein (ABCG2)-mediated active efflux. J Pharmacol Exp Ther 334:147–155 - PMC - PubMed
    1. Allen JD, van Loevezijn A, Lakhai JM, van der Valk M, van Tellingen O, Reid G, Schellens JH, Koomen GJ, Schinkel AH. (2002) Potent and specific inhibition of the breast cancer resistance protein multidrug transporter in vitro and in mouse intestine by a novel analogue of fumitremorgin C. Mol Cancer Ther 1:417–425 - PubMed
    1. Bailer AJ. (1988) Testing for the equality of area under the curves when using destructive measurement techniques. J Pharmacokinet Biopharm 16:303–309 - PubMed
    1. Begley DJ. (2004) ABC transporters and the blood-brain barrier. Curr Pharm Des 10:1295–1312 - PubMed
    1. Bellmunt J, Eisen T, Fishman M, Quinn D. (2010) Experience with sorafenib and adverse event management. Crit Rev Oncol Hematol doi:10.1016/j.critrevonc.2010,03.006 - DOI - PubMed

Publication types

MeSH terms