. 2010 Dec 1;70(23):9650-8.
doi: 10.1158/0008-5472.CAN-10-1146. Epub 2010 Oct 15.

p53 status in stromal fibroblasts modulates tumor growth in an SDF1-dependent manner

Affiliations

p53 status in stromal fibroblasts modulates tumor growth in an SDF1-dependent manner

Yoseph Addadi et al. Cancer Res. .

Abstract

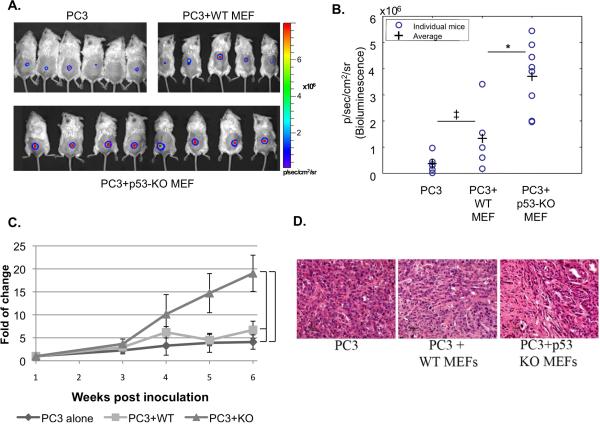
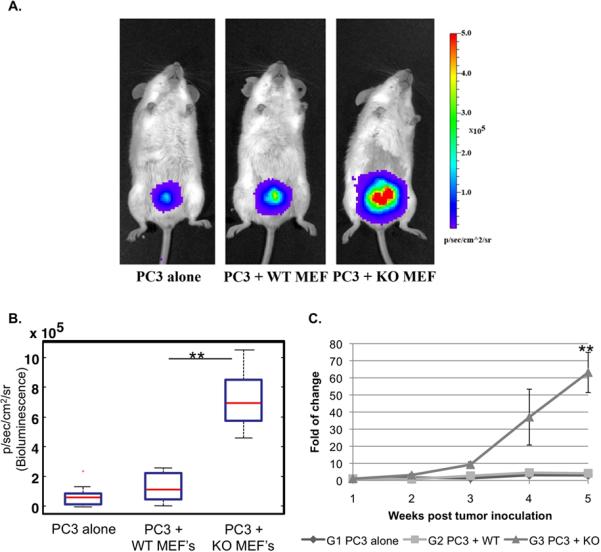
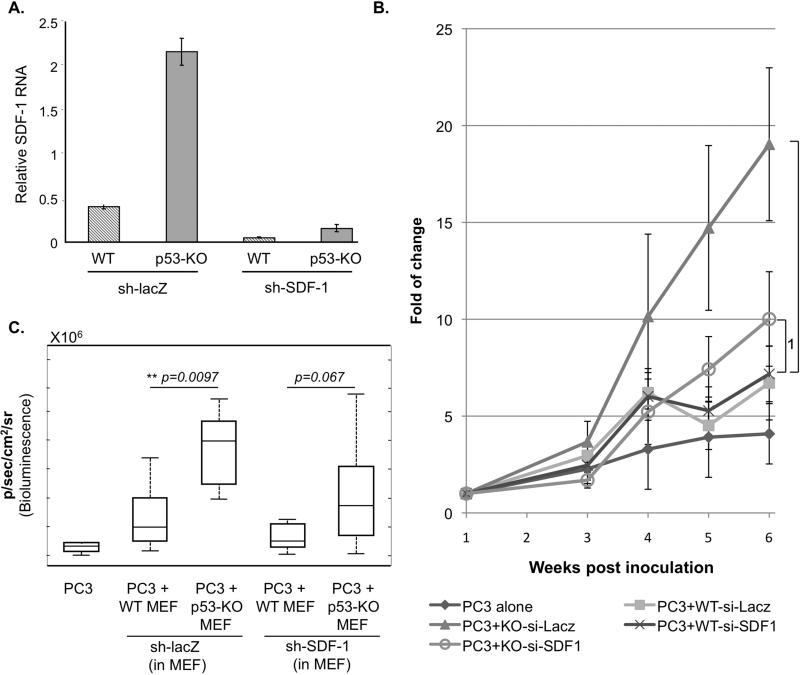
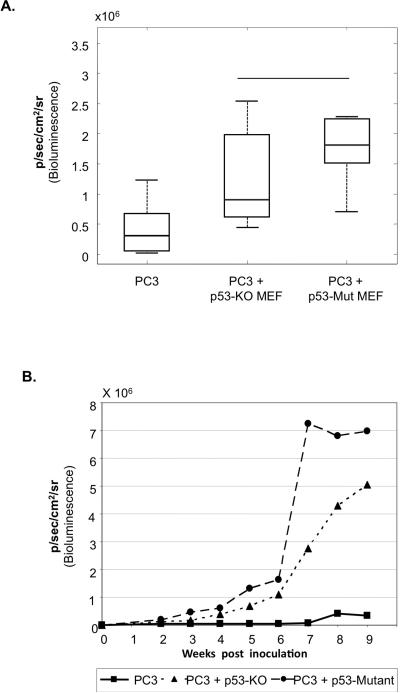
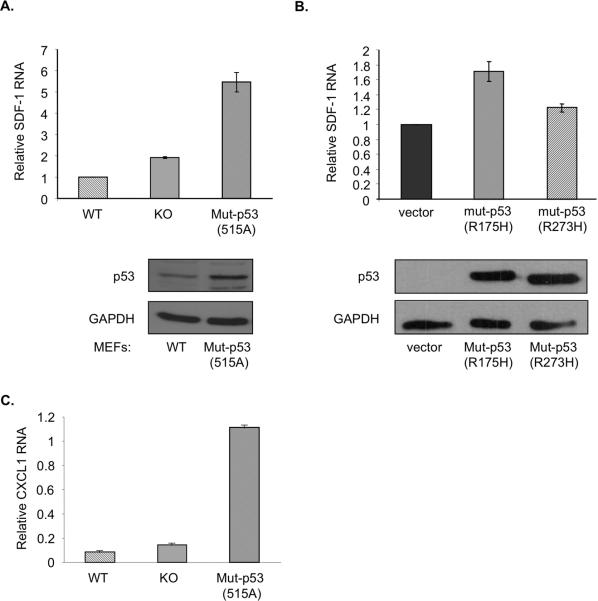
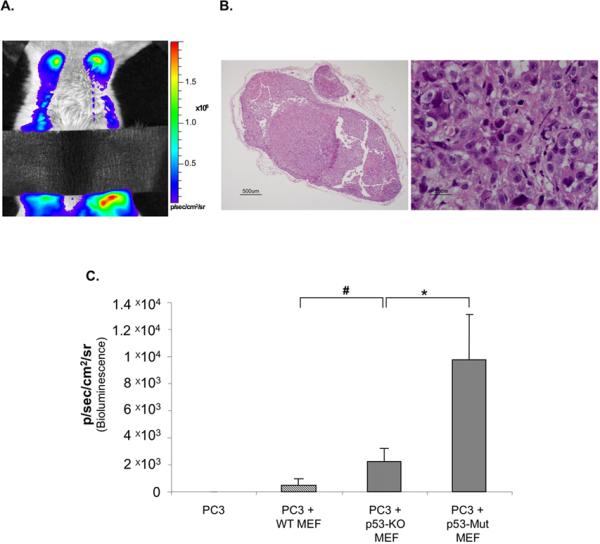
The p53 tumor suppressor exerts a variety of cell-autonomous effects that are aimed to thwart tumor development. In addition, however, there is growing evidence for cell nonautonomous tumor suppressor effects of p53. In the present study, we investigated the impact of stromal p53 on tumor growth. Specifically, we found that ablation of p53 in fibroblasts enabled them to promote more efficiently the growth of tumors initiated by PC3 prostate cancer-derived cells. This stimulatory effect was dependent on the increased expression of the chemokine SDF-1 in the p53-deficient fibroblasts. Notably, fibroblasts harboring mutant p53 protein were more effective than p53-null fibroblasts in promoting tumor growth. The presence of either p53-null or p53-mutant fibroblasts led also to a markedly elevated rate of metastatic spread of the PC3 tumors. These findings implicate p53 in a cell nonautonomous tumor suppressor role within stromal fibroblasts, through suppressing the production of tumor stimulatory factors by these cells. Moreover, expression of mutant p53 by tumor stroma fibroblasts might exert a gain of function effect, further accelerating tumor development.


Figures

Fig 1
Fig 1. Effect of stromal p53 on PC3 tumor growth
PC3 cells (2×10⁶) expressing luciferase were inoculated subcutaneously, either alone or together with WT MEFs or p53-KO MEFs (1×10⁶), in the back of male SCID mice (n=8 per group; total inoculation volume 30 μl). Every 1-2 weeks tumor load was measured by bioluminescence imaging of luciferase activity. A. Color-coded luciferase bioluminescence images acquired 6 weeks after inoculation. B. Distribution of luciferase bioluminescence values for individual mice 6 weeks post tumor inoculation is presented. P-value; * = 0.0097 ‡ = 0.16 C. Kinetics of tumor growth. For each time point the fold of change in luciferase bioluminescence intensity of each mouse was calculated relative to the initial luciferase signal of the same mouse, which was measured one week post inoculation. The average tumor load of all mice in the same group was calculated for each time point and plotted. P-values: 1 = 0.318, 2 = 0.025, 3 = 0.01; p-values relate to the last time point (6 weeks). D. H&E staining of histological sections from a representative tumor of each group, acquired 7 weeks post inoculation.
Fig 2
Fig 2. Effect of stromal p53 on orthotopic PC3 tumor growth
PC3 cells (1×10⁶) expressing luciferase were inoculated either alone or together with WT MEFs or p53-KO MEFs (0.5×10⁶), in the prostate left lobe of male SCID mice (n=10 per group; total inoculation volume 20μl). Tumor growth was measured weekly by bioluminescence imaging. A. Color-coded representative bioluminescence images, 5 weeks after inoculation. B. Distribution of luciferase bioluminescence values in each group, 5 weeks after inoculation. ** p= 9×10⁻⁵ C. Kinetics of tumor growth. Analysis performed as in Fig1C.** p= 2×10⁻⁴ ;p-values relate to the last time point (5 weeks).
Fig 3
Fig 3. p53-mediated repression of SDF-1 expression in stromal fibroblasts attenuates tumor growth in-vivo
A. In-vitro evaluation of the efficacy of SDF-1 knockdown. WT and p53-KO MEFs were infected with retroviruses expressing either SDF-1 shRNA (sh-SDF1) or control shRNA (sh-lacZ). Following 48 hr of selection with puromycin, the pool of cells were harvested and RNA expression analysis was carried out. Real-time qPCR was preformed on cDNA prepared from total RNA using primers specific for SDF-1 and beta actin. Relative levels of SDF-1 mRNA are shown after normalization to the β-actin control. C,B. PC3 cells (2×10⁶) expressing luciferase were inoculated subcutaneously either alone or together with the indicated types of MEFs as in Fig. 1 (n=8 per group). Prior to inoculation, expression of SDF-1 in the MEFs was knocked down by stable infection with a recombinant retrovirus expressing SDF-1 shRNA (sh-SDF1). Tumor progression was monitored as in Fig. 1. The data shown is from the same experiment as in Fig 1. B. Kinetics of tumor growth. Analysis was performed as in Fig. 1C. p-values: 1= 0.336, 2= 0.025. C. Luciferase bioluminescence of each group of mice, determined 6 weeks post inoculation. On each box, the central mark is the median, the edges of the box are the 25th and 75th percentiles, whiskers extend to the most extreme data points not considered outliers.
Fig 4
Fig 4. Mutant p53 in stromal fibroblasts exerts a gain of function effect on tumor growth
PC3 cells (2×10⁶) expressing luciferase were inoculated subcutaneously, either alone or together with p53-KO or p53-mutant MEFs (1×10⁶) as in Fig. 1. (n=12 per group). A. Luciferase bioluminescence of each group of mice, determined 7 weeks post inoculation. Boxes are as in Fig. 3C. * p= 0.02 B. The average luciferase bioluminescence of all mice in the same group was calculated for each time point and plotted.
Fig 5
Fig 5. Mutant p53 augments the expression of SDF-1 and CXCL1 mRNA in fibroblasts
A. Primary MEFs were isolated from 13.5 days old embryos of wt, p53-KO or mutant p53 (515A) mice and harvested for RNA and protein analysis at passages 3-4. Real-time qPCR was preformed on cDNA prepared from total RNA using primers specific for SDF-1, CXCL1 and HPRT. Relative levels of SDF-1 mRNA are shown after normalization for HPRT mRNA. Lower panel shows a Western blot analysis of WTp53 and mutant p53 levels. B. p53-KO MEFs were infected with recombinant retroviruses encoding two different cancer-associated human p53 mutants (p53R175H and p53R273H, respectively) or with control retrovirus. Following puromycin selection the cells were harvested for RNA and protein analysis. Real-time qRT-PCR was preformed and relative SDF-1 mRNA levels determined as in (A). Lower panel shows a Western blot analysis of exogenous mutant p53 levels. C. The same RNA samples as in (A) were analyzed for relative CXCL1 mRNA levels.
Fig 6
Fig 6. Loss of WTp53 and expression of mutant p53 in the primary tumor stroma promote metastasis
PC3 cells (2×10⁶) expressing luciferase were inoculated subcutaneously into mice, either alone or together with WT, p53-KO or p53-mutant MEFs (1×10⁶) as in Fig. 1 (n=12 per group). A. Color-coded luciferase bioluminescence image acquired with the IVIS system 7 weeks post inoculation, showing bioluminescence from the lymph nodes and lungs. Black tape was used to block the high bioluminescence originating from the primary tumor. B. Representative H&E staining of the excised metastasized inguinal lymph node. C. Average bioluminescence of lymph node metastases calculated for each group of mice 7 weeks post inoculation. p-values: # =0.056; *=0.025.

Similar articles

Cited by

References

    1. Hill R, et al. Selective evolution of stromal mesenchyme with p53 loss in response to epithelial tumorigenesis. Cell. 2005;123(6):1001–11. - PubMed
    1. Tlsty TD, Hein PW. Know thy neighbor: stromal cells can contribute oncogenic signals. Curr Opin Genet Dev. 2001;11(1):54–9. - PubMed
    1. Kalluri R, Zeisberg M. Fibroblasts in cancer. Nat Rev Cancer. 2006;6(5):392–401. - PubMed
    1. Olumi AF, et al. Carcinoma-associated fibroblasts direct tumoprogression of initiated human prostatic epithelium. Cancer Res. 1999;59(19):5002–11. - PMC - PubMed
    1. Karnoub AE, et al. Mesenchymal stem cells within tumour stroma promote breast cancer metastasis. Nature. 2007;449(7162):557–63. - PubMed

Publication types

MeSH terms