

Functional analyses of caffeic acid O-Methyltransferase and Cinnamoyl-CoA-reductase genes from perennial ryegrass (Lolium perenne)
- PMID: 20952635
- PMCID: PMC2990129
- DOI: 10.1105/tpc.109.072827
Functional analyses of caffeic acid O-Methyltransferase and Cinnamoyl-CoA-reductase genes from perennial ryegrass (Lolium perenne)
Abstract
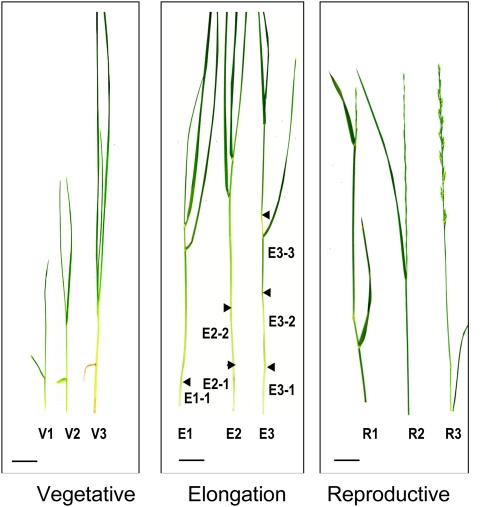
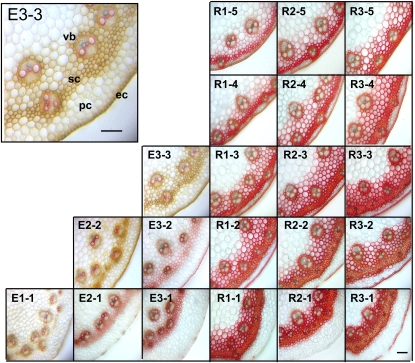
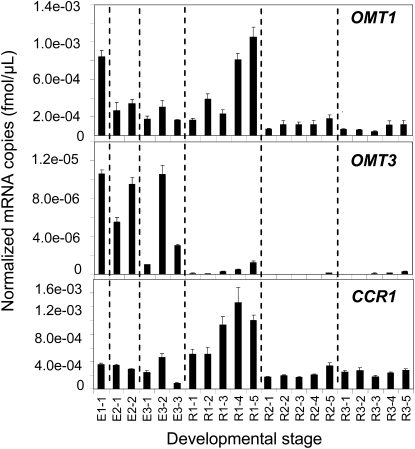
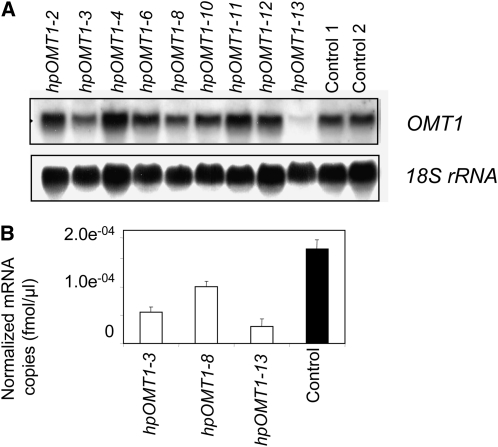
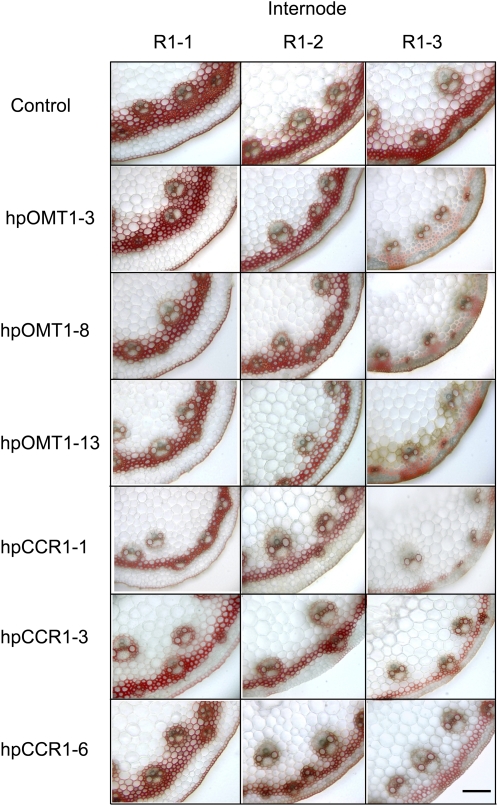
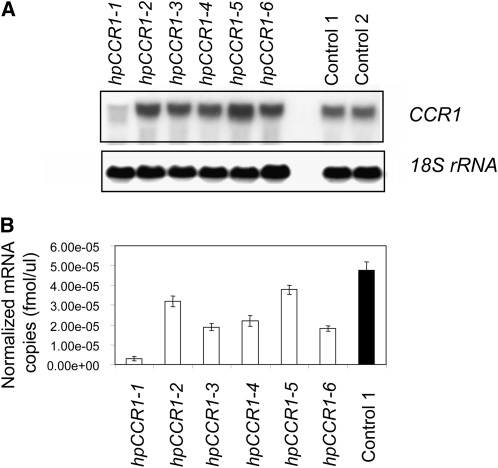
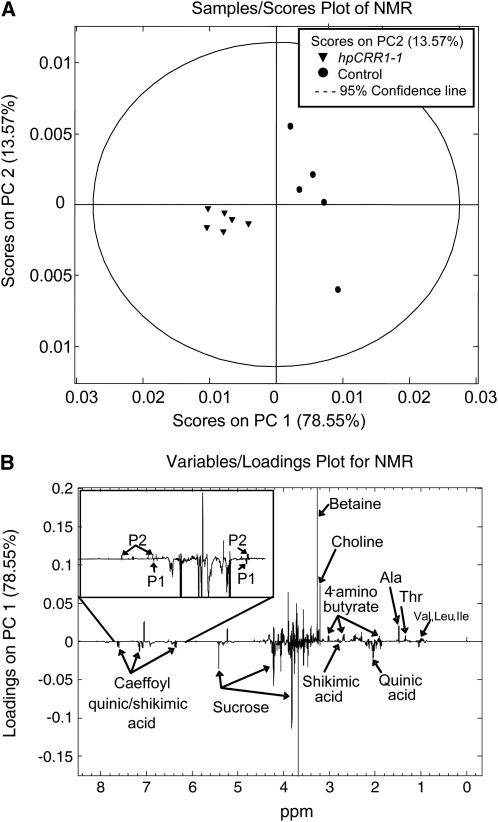
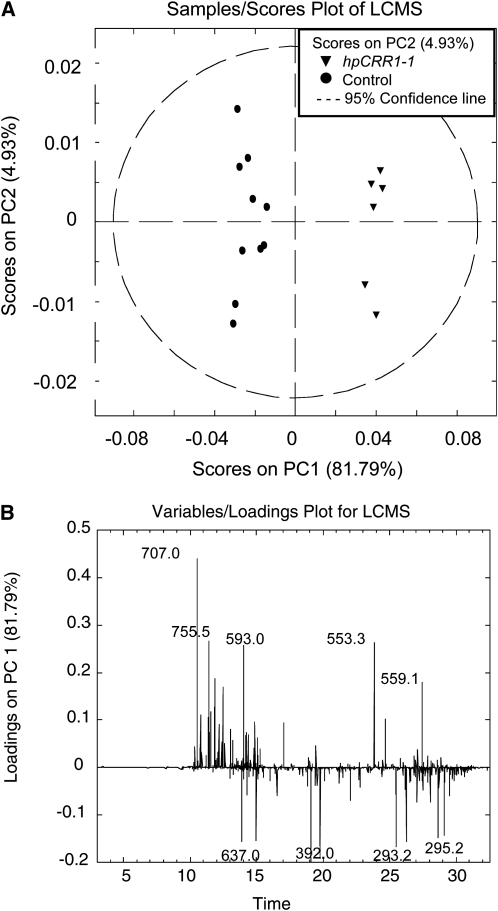
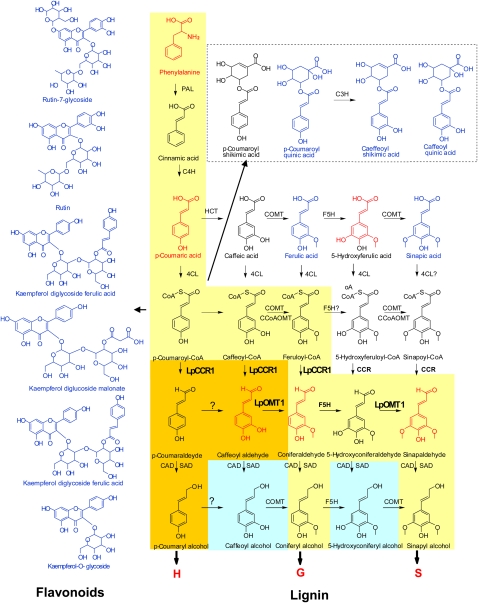
Cinnamoyl CoA-reductase (CCR) and caffeic acid O-methyltransferase (COMT) catalyze key steps in the biosynthesis of monolignols, which serve as building blocks in the formation of plant lignin. We identified candidate genes encoding these two enzymes in perennial ryegrass (Lolium perenne) and show that the spatio-temporal expression patterns of these genes in planta correlate well with the developmental profile of lignin deposition. Downregulation of CCR1 and caffeic acid O-methyltransferase 1 (OMT1) using an RNA interference-mediated silencing strategy caused dramatic changes in lignin level and composition in transgenic perennial ryegrass plants grown under both glasshouse and field conditions. In CCR1-deficient perennial ryegrass plants, metabolic profiling indicates the redirection of intermediates both within and beyond the core phenylpropanoid pathway. The combined results strongly support a key role for the OMT1 gene product in the biosynthesis of both syringyl- and guaiacyl-lignin subunits in perennial ryegrass. Both field-grown OMT1-deficient and CCR1-deficient perennial ryegrass plants showed enhanced digestibility without obvious detrimental effects on either plant fitness or biomass production. This highlights the potential of metabolic engineering not only to enhance the forage quality of grasses but also to produce optimal feedstock plants for biofuel production.
Figures
Similar articles
-
Clade classification of monolignol biosynthesis gene family members reveals target genes to decrease lignin in Lolium perenne.Plant Biol (Stuttg). 2015 Jul;17(4):877-92. doi: 10.1111/plb.12316. Epub 2015 Mar 13. Plant Biol (Stuttg). 2015. PMID: 25683375
-
Structure-function analyses of a caffeic acid O-methyltransferase from perennial ryegrass reveal the molecular basis for substrate preference.Plant Cell. 2010 Dec;22(12):4114-27. doi: 10.1105/tpc.110.077578. Epub 2010 Dec 21. Plant Cell. 2010. PMID: 21177481 Free PMC article.
-
Functional characterization of cinnamyl alcohol dehydrogenase and caffeic acid O-methyltransferase in Brachypodium distachyon.BMC Biotechnol. 2013 Jul 31;13:61. doi: 10.1186/1472-6750-13-61. BMC Biotechnol. 2013. PMID: 23902793 Free PMC article.
-
Trends in lignin modification: a comprehensive analysis of the effects of genetic manipulations/mutations on lignification and vascular integrity.Phytochemistry. 2002 Oct;61(3):221-94. doi: 10.1016/s0031-9422(02)00211-x. Phytochemistry. 2002. PMID: 12359514 Review.
-
Multifunctional 5-hydroxyconiferaldehyde O-methyltransferases (CAldOMTs) in plant metabolism.J Exp Bot. 2024 Mar 14;75(6):1671-1695. doi: 10.1093/jxb/erae011. J Exp Bot. 2024. PMID: 38198655 Review.
Cited by
-
De novo Transcriptome Analysis of Rhizoctonia solani AG1 IA Strain Early Invasion in Zoysia japonica Root.Front Microbiol. 2016 May 18;7:708. doi: 10.3389/fmicb.2016.00708. eCollection 2016. Front Microbiol. 2016. PMID: 27242730 Free PMC article.
-
Characterization of a cinnamoyl-CoA reductase 1 (CCR1) mutant in maize: effects on lignification, fibre development, and global gene expression.J Exp Bot. 2011 Jul;62(11):3837-48. doi: 10.1093/jxb/err077. Epub 2011 Apr 14. J Exp Bot. 2011. PMID: 21493812 Free PMC article.
-
FaPOD27 functions in the metabolism of polyphenols in strawberry fruit (Fragaria sp.).Front Plant Sci. 2014 Oct 9;5:518. doi: 10.3389/fpls.2014.00518. eCollection 2014. Front Plant Sci. 2014. PMID: 25346738 Free PMC article.
-
Global transcriptome analysis of constitutive resistance to the white pine weevil in spruce.Genome Biol Evol. 2011;3:851-67. doi: 10.1093/gbe/evr069. Epub 2011 Aug 17. Genome Biol Evol. 2011. PMID: 21852250 Free PMC article.
-
Biochemical characterization and expression analysis of lignification in two pear (Pyrus ussuriensis Maxim.) varieties with contrasting stone cell content.Protoplasma. 2020 Jan;257(1):261-274. doi: 10.1007/s00709-019-01434-7. Epub 2019 Sep 3. Protoplasma. 2020. PMID: 31482203
References
-
- Anterola A.M., Lewis N.G. (2002). Trends in lignin modification: A comprehensive analysis of the effects of genetic manipulations/mutations on lignification and vascular integrity. Phytochemistry 61: 221–294 - PubMed
-
- Atanassova R., Favet N., Martz F., Chabbert B., Tollier M.-T., Monties B., Fritig B., Legrand M. (1995). Altered lignin composition in transgenic tobacco expressing O-methyltransferase sequences in sense and antisense orientation. Plant J. 8: 465–477
-
- Barnes R.F., Muller L.D., Bauman L.F., Colenbrander V.F. (1971). In vitro dry matter disappearance of brown-midrib mutants of maize (Zea mays L.). J. Anim. Sci. 33: 881–884
-
- Bilang R., Iida S., Peterhans A., Potrykus I., Paszkowski J. (1991). The 3′-terminal region of the hygromycin-B-resistance gene is important for its activity in Escherichia coli and Nicotiana tabacum. Gene 100: 247–250 - PubMed
MeSH terms
Substances
Associated data
- Actions
- Actions
- Actions
- Actions
- Actions
LinkOut - more resources
Full Text Sources
Miscellaneous
