

Accumulation of non-superoxide anion reactive oxygen species mediates nitrogen-limited alcoholic fermentation by Saccharomyces cerevisiae
- PMID: 20952643
- PMCID: PMC3008223
- DOI: 10.1128/AEM.01535-10
Accumulation of non-superoxide anion reactive oxygen species mediates nitrogen-limited alcoholic fermentation by Saccharomyces cerevisiae
Abstract
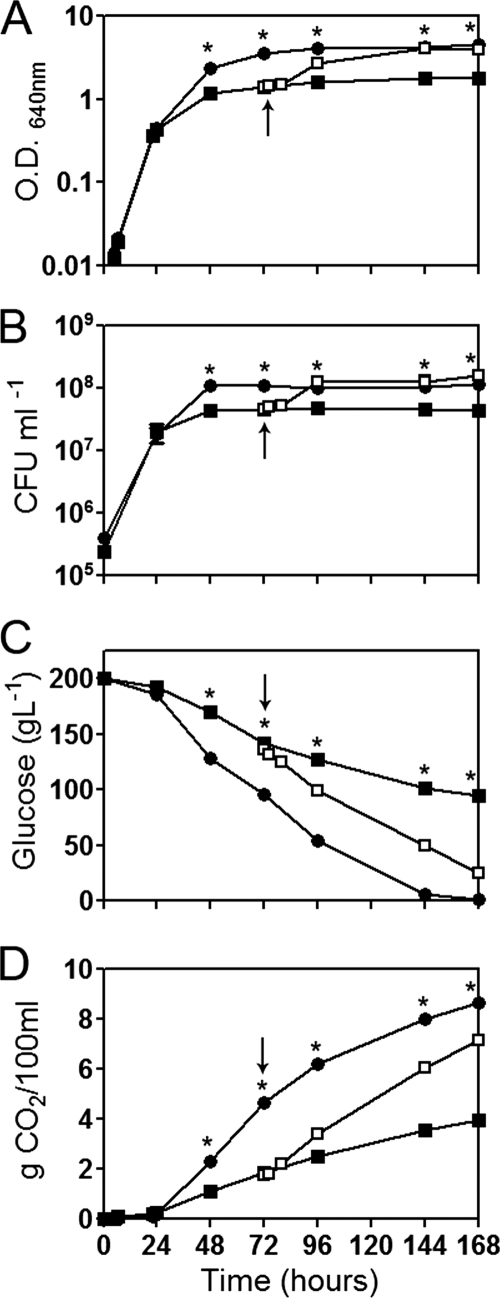
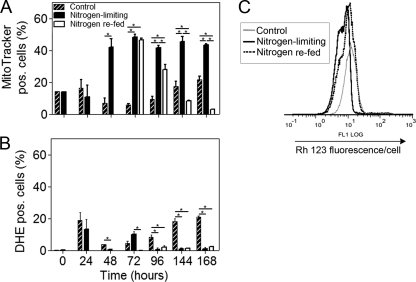
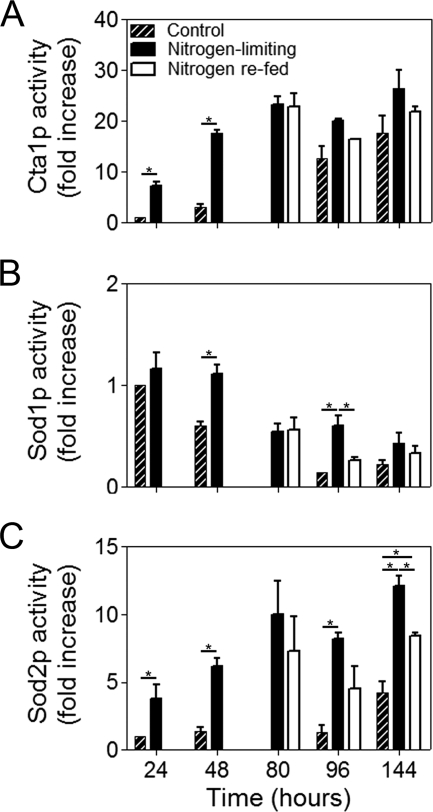
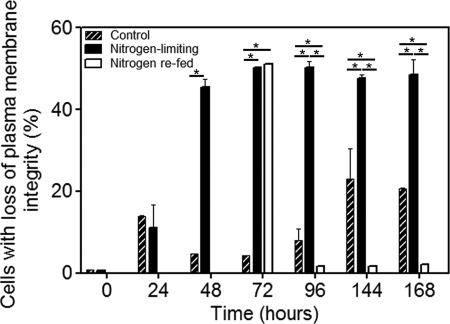
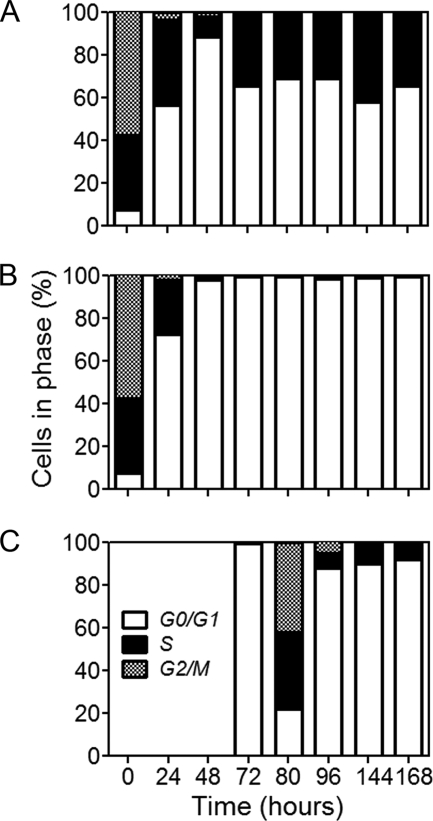
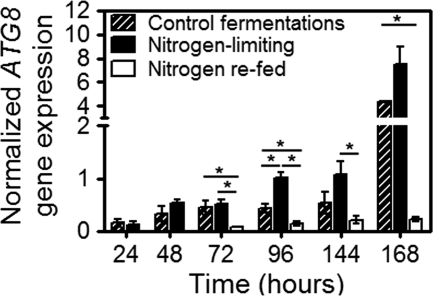
Throughout alcoholic fermentation, nitrogen depletion is one of the most important environmental stresses that can negatively affect the yeast metabolic activity and ultimately leads to fermentation arrest. Thus, the identification of the underlying effects and biomarkers of nitrogen limitation is valuable for controlling, and therefore optimizing, alcoholic fermentation. In this study, reactive oxygen species (ROS), plasma membrane integrity, and cell cycle were evaluated in a wine strain of Saccharomyces cerevisiae during alcoholic fermentation in nitrogen-limiting medium under anaerobic conditions. The results indicated that nitrogen limitation leads to an increase in ROS and that the superoxide anion is a minor component of the ROS, but there is increased activity of both Sod2p and Cta1p. Associated with these effects was a decrease in plasma membrane integrity and a persistent cell cycle arrest at G(0)/G(1) phases. Moreover, under these conditions it appears that autophagy, evaluated by ATG8 expression, is induced, suggesting that this mechanism is essential for cell survival but does not prevent the cell cycle arrest observed in slow fermentation. Conversely, nitrogen refeeding allowed cells to reenter cell cycle by decreasing ROS generation and autophagy. Altogether, the results provide new insights on the understanding of wine fermentations under nitrogen-limiting conditions and further indicate that ROS accumulation, evaluated by the MitoTracker Red dye CM-H(2)XRos, and plasma membrane integrity could be useful as predictive markers of fermentation problems.
Figures
Similar articles
-
Responses of Saccharomyces cerevisiae to nitrogen starvation in wine alcoholic fermentation.Appl Microbiol Biotechnol. 2015 Sep;99(17):7025-34. doi: 10.1007/s00253-015-6810-z. Epub 2015 Jul 23. Appl Microbiol Biotechnol. 2015. PMID: 26201494 Review.
-
Ethanol Induces Autophagy Regulated by Mitochondrial ROS in Saccharomyces cerevisiae.J Microbiol Biotechnol. 2018 Dec 28;28(12):1982-1991. doi: 10.4014/jmb.1806.06014. J Microbiol Biotechnol. 2018. PMID: 30394045
-
Effects of melatonin and tryptophol addition on fermentations carried out by Saccharomyces cerevisiae and non-Saccharomyces yeast species under different nitrogen conditions.Int J Food Microbiol. 2019 Jan 16;289:174-181. doi: 10.1016/j.ijfoodmicro.2018.09.013. Epub 2018 Sep 17. Int J Food Microbiol. 2019. PMID: 30253310
-
Biomass production and alcoholic fermentation performance of Saccharomyces cerevisiae as a function of nitrogen source.FEMS Yeast Res. 2012 Jun;12(4):477-85. doi: 10.1111/j.1567-1364.2012.00802.x. Epub 2012 Apr 10. FEMS Yeast Res. 2012. PMID: 22429249
-
Influence of nitrogen status in wine alcoholic fermentation.Food Microbiol. 2019 Oct;83:71-85. doi: 10.1016/j.fm.2019.04.008. Epub 2019 Apr 23. Food Microbiol. 2019. PMID: 31202421 Review.
Cited by
-
Evolutionary Advantage Conferred by an Eukaryote-to-Eukaryote Gene Transfer Event in Wine Yeasts.Mol Biol Evol. 2015 Jul;32(7):1695-707. doi: 10.1093/molbev/msv057. Epub 2015 Mar 6. Mol Biol Evol. 2015. PMID: 25750179 Free PMC article.
-
New Insights into the Modification of the Non-Core Metabolic Pathway of Steroids in Mycolicibacterium and the Application of Fermentation Biotechnology in C-19 Steroid Production.Int J Mol Sci. 2023 Mar 9;24(6):5236. doi: 10.3390/ijms24065236. Int J Mol Sci. 2023. PMID: 36982310 Free PMC article. Review.
-
Use of chemostat cultures mimicking different phases of wine fermentations as a tool for quantitative physiological analysis.Microb Cell Fact. 2014 Jun 13;13:85. doi: 10.1186/1475-2859-13-85. Microb Cell Fact. 2014. PMID: 24928139 Free PMC article.
-
Nitrogen limitation causes a seismic shift in redox state and phosphorylation of proteins implicated in carbon flux and lipidome remodeling in Rhodotorula toruloides.Biotechnol Biofuels Bioprod. 2025 Jul 21;18(1):80. doi: 10.1186/s13068-025-02657-y. Biotechnol Biofuels Bioprod. 2025. PMID: 40691609 Free PMC article.
-
Fermented Grapevine Leaves: Potential Preserving Agent in Yogurt.Foods. 2024 Jun 27;13(13):2053. doi: 10.3390/foods13132053. Foods. 2024. PMID: 38998560 Free PMC article.
References
-
- Aebi, H. 1984. Catalase in vitro. Methods Enzymol. 105:121-126. - PubMed
-
- Almeida, B., S. Ohlmeier, A. J. Almeida, F. Madeo, C. Leao, F. Rodrigues, and P. Ludovico. 2009. Yeast protein expression profile during acetic acid-induced apoptosis indicates causal involvement of the TOR pathway. Proteomics 9:720-732. - PubMed
-
- Almeida, B., B. Sampaio-Marques, J. Carvalho, M. T. Silva, C. Leao, F. Rodrigues, and P. Ludovico. 2007. An atypical active cell death process underlies the fungicidal activity of ciclopirox olamine against the yeast Saccharomyces cerevisiae. FEMS Yeast Res. 7:404-412. - PubMed
-
- Attfield, P. V. 1997. Stress tolerance: the key to effective strains of industrial baker's yeast. Nat. Biotechnol. 15:1351-1357. - PubMed
-
- Backhus, L. E., J. DeRisi, and L. F. Bisson. 2001. Functional genomic analysis of a commercial wine strain of Saccharomyces cerevisiae under differing nitrogen conditions. FEMS Yeast Res. 1:111-125. - PubMed
Publication types
MeSH terms
Substances
LinkOut - more resources
Full Text Sources
Molecular Biology Databases
