. 2010 Nov 15;185(10):5859-68.
doi: 10.4049/jimmunol.1001187. Epub 2010 Oct 15.

Impaired apoptotic cell clearance in the germinal center by Mer-deficient tingible body macrophages leads to enhanced antibody-forming cell and germinal center responses

Affiliations

Impaired apoptotic cell clearance in the germinal center by Mer-deficient tingible body macrophages leads to enhanced antibody-forming cell and germinal center responses

Ziaur S M Rahman et al. J Immunol. .

Abstract

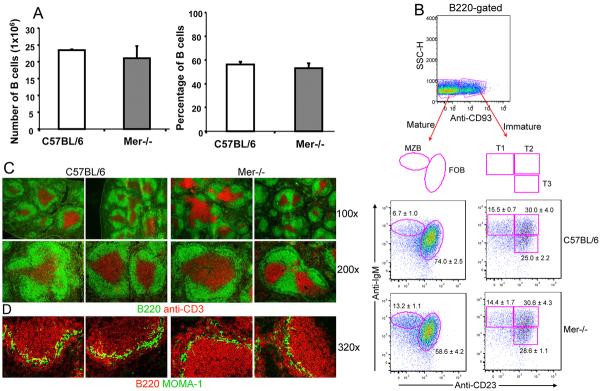
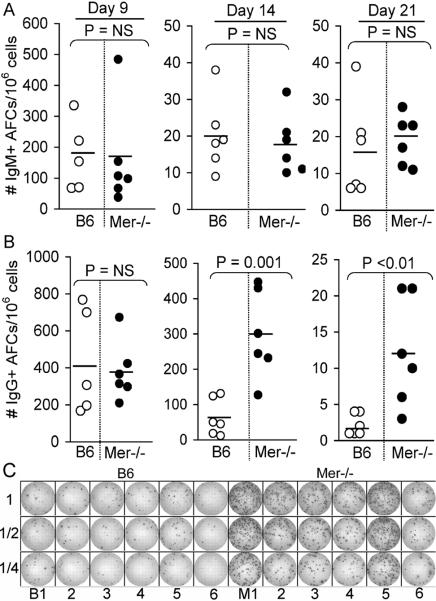
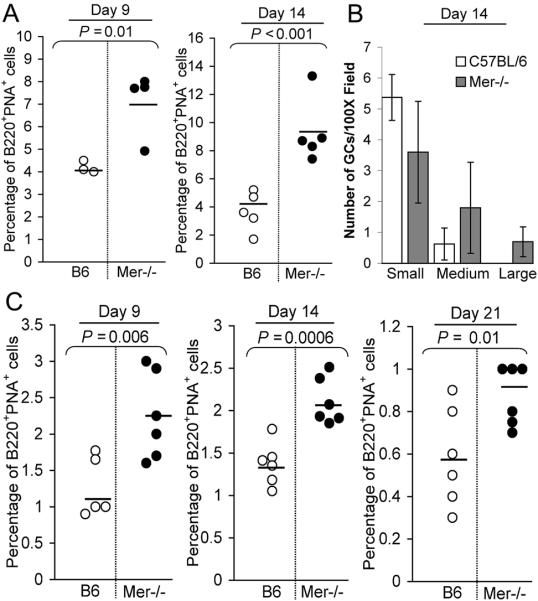
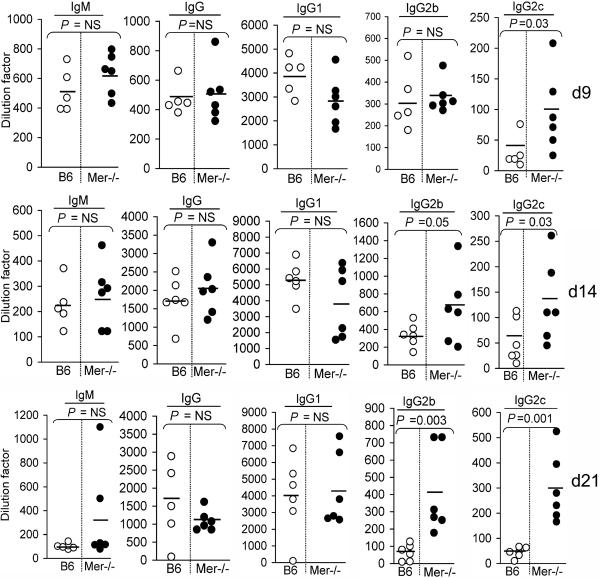
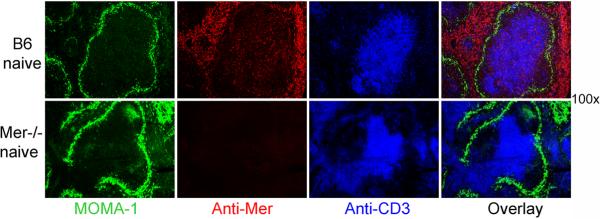
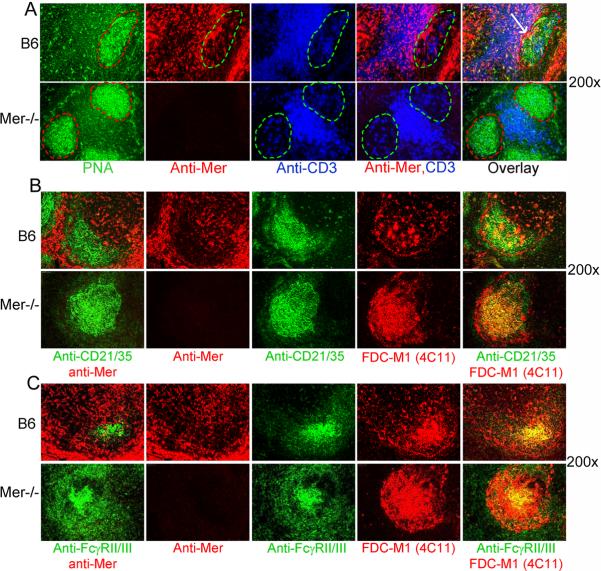
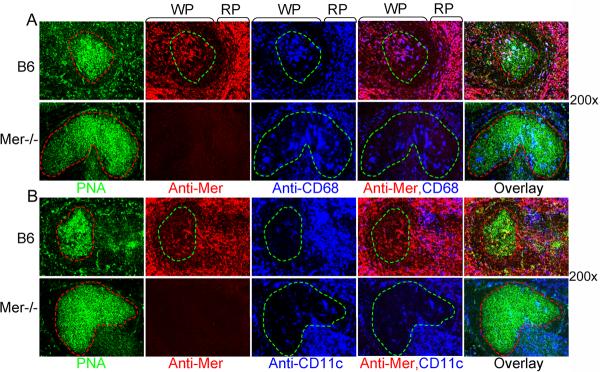
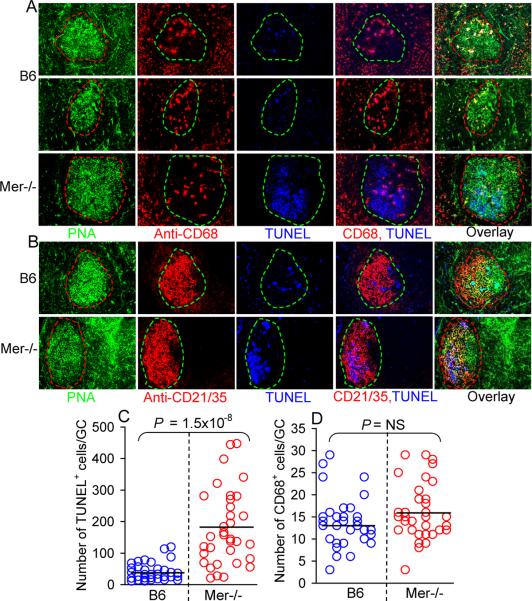
Germinal centers (GCs) are specialized microenvironments that generate high-affinity Ab-forming cells (AFCs) and memory B cells. Many B cells undergo apoptosis during B cell clonal selection in GCs. Although the factors that regulate the AFC and GC responses are not precisely understood, it is widely believed that dysregulated AFCs and GCs contribute to autoimmunity. The Mer receptor tyrosine kinase (Mer) facilitates macrophage clearance of apoptotic cells. The Tyro-3, Axl, and Mer receptors, including Mer, suppress TLRs and cytokine-mediated inflammatory responses. We report in this study that tingible body macrophages (TBMφs) in GCs express Mer. Compared to C57BL/6 (B6) controls, Mer-deficient (Mer(-/-)) mice had significantly higher AFC, GC, and Th1-skewed IgG2 Ab (especially IgG2c) responses against the T cell-dependent Ag (4-hydroxy-3-nitrophenyl) acetyl-chicken γ globulin. Mer(-/-) mice had a significantly higher percentage of GC B cells on days 9, 14, and 21 postimmunization compared with B6 controls. Significantly increased numbers of apoptotic cells accumulated in Mer(-/-) GCs than in B6 GCs, whereas the number of TBMφs remained similar in both strains. Our data are the first, to our knowledge, to demonstrate a critical role for Mer in GC apoptotic cell clearance by TBMφs and have interesting implications for Mer in the regulation of B cell tolerance operative in the AFC and GC pathways.


Figures

Figure 1
Figure 1. Primary development of B cells in the presence or absence of Mer
Panel (A–B): Quantitative and four color flow cytometric analysis was performed on spleen cells obtained from B6 and Mer−/− mice after staining with B220, anti-CD93, anti-IgM and anti-CD23. (A) Total number of B cells (left panel) and the percentage of B220+ cells (right panel) are shown in C57BL/6 (open bar) and Mer−/− (shaded bar) sex matched 8–10 wk old mice. (B) The percentage of mature (B220+CD93neg) and immature (B220+CD93neg) B cells are shown in the top panel. Subdivision of mature and immature B cells into marginal zone (MZB), follicular (FOB), and transitional type 1 (T1), T2 and T3 populations are shown by oval and rectangular gates, respectively, in the lower panels. The percentage of each B cell population in the spleens of B6 (middle two panels) and Mer−/− (bottom two panels) mice is indicated next to each gate. (C) Spleen sections obtained from naïve mice of the indicated genotypes were stained with B220 (green), anti-CD3 (red) and images captured by fluorescence microscopy. Original magnification of images was 100× (upper row) and 200× (lower row). (D) Similar analysis described in the legend to Figure 1C was done in which spleen sections were stained with B220 (red) and MOMA-1 (green). Original magnification of images was 320×. All data are representative of at least three mice per group.
Figure 2
Figure 2. Primary IgM and IgG AFC responses in the presence or absence of Mer
The number of splenic NP-specific IgM (A, upper panel) and IgG (B, lower panel) secreting AFCs were measured by ELISpot assay 9, 14 and 21 days after immunization of B6 and Mer−/−mice with NP-CGG. Each circle represents the number of AFCs per 1×10⁶ splenocytes obtained from an individual mouse. Open and closed circles represent data from B6 and Mer−/− mice, respectively. Horizontal bars represent the average number of AFCs. Statistical analysis was performed by Student's t-test. (C) A representative image of an ELISpot assay obtained on day 14 of the anti-NP response in six B6 (B1–6, left) and six Mer−/− (M1–6, right) mice is shown. As described in Materials and Methods, one million (1×10⁶) splenocytes were plated in the first row and subsequently two-fold serial dilution was carried out for each sample (indicated in the left side of the image as 1, 1/2 and 1/4). These data were obtained from age and sex-matched five to six mice of each genotype.
Figure 3
Figure 3. Enhanced GC responses of B cells deficient in Mer
(A) Splenocytes obtained on days 9 and 14 post-immunization from NP-CGG immunized B6 (open circle) and Mer−/− (closed circle) mice were stained with B220 and the GC B cell marker PNA. The percentage of B220+PNA+ GC B cells is shown. Horizontal bars represent the average percentage of GC B cells. (B) Spleen sections obtained from B6 and Mer−/− mice on day 14 of the NP-CGG response were stained with the GC marker PNA. The number of small, medium and large GCs per 100× magnification field was counted from randomly chosen areas on spleens from B6 (open bar) and Mer−/− (shaded bar) mice. GCs in two randomly chosen fields per mouse spleen were counted. Statistical analysis was performed by Student's t-test. These data were obtained from three to five mice of each genotype. (C) Splenocytes obtained on days 9 (left), 14 (middle) and 21 (right) post-immunization from NP-CGG immunized B6 (open) and Mer−/−(closed) mice were stained with B220 and the GC B cell marker PNA. The percentage of B220+PNA+ GC B cells for each time point is shown. These data were obtained from five to six mice of each genotype.
Figure 4
Figure 4. Elevated levels of T-dependent (TD) Ab responses in Mer−/− mice
(A) TD-Ag induced anti-NP total IgM, IgG, IgG1, IgG2b and IgG2c titers were measured by ELISA in B6 (◯) and Mer−/− (●) serum samples obtained on day 14 post-immunization of these mice with NP-CGG. (B) The kinetics of these Ab responses was obtained by measuring Ab levels in sera from B6 (◯) and Mer−/− (●) mice on day 9 (top), 14 (middle) and 21 (bottom). These data were obtained from five to six mice of each genotype on each time point.
Figure 5
Figure 5. Localizations of Mer expressing cells in the spleen
Spleen sections obtained from naïve B6 (top row) and Mer−/− (bottom row) mice were stained with MOMA-1 (green), anti-Mer (red) and anti-CD3 (blue). The images were captured by fluorescence microscopy. Original magnification of images was 100×. These data represent four to five mice of each genotype.
Figure 6
Figure 6. Mer expressing cells within GCs do not co-localize with FDCs
(A): Immunohistological analysis of spleen sections, obtained from B6 (top row) and Mer−/− mice (bottom row) on day 14 after NP-CGG immunization, was performed using PNA (green), anti-Mer (red) and anti-CD3 (blue). In the 1st column, PNA+ (green) GC area is shown in dotted red line. In the 2nd column, the localization of Mer expressing cells within the GC marked by the dotted green line is shown. In the 3rd column, the presence of follicular helper T cells within the GC is also shown in a similar green area. In the 4th column, two color overlay image of anti-Mer (red) and anti-CD3 (blue) staining is shown. In the 5th column, the distribution of Mer expressing cells in GCs, T cell zone and in the red pulp areas are shown in the three color overlay image. Arrow indicates the accumulation of Mer+ cells at the border between GC and T cell zone. (B) Similar immunohistology analysis as in Panel A was performed in which two adjacent spleen sections were analyzed. One section was co-stained with anti-CD21/35 (green) and anti-Mer (red) and the other was stained with anti-CD21/35 (green) and FDC marker FDC-M1 (red). (C) Similar analysis as in Panel B was performed in which anti-CD21/35 (green) staining was replaced by 2.4G2 (FcγRII/III). Original magnification of images was 200×. These data were obtained from four to five mice of each genotype.
Figure 7
Figure 7. Tingible body macrophages in GCs express Mer
Multicolor immunohistological analysis of spleen sections, obtained from B6 (top row) and Mer−/− mice (bottom row) on day 14 after NP-CGG immunization, was performed using PNA (green), anti-Mer (red) and anti-CD68 (blue). In the 1st column, the GC areas shown in dotted red lines were defined by the presence of PNA+ cells (green). These GC areas were carried over to subsequent panels to show Mer+ (2nd column) and CD68+ (3rd column) cells within GCs. Two (anti-Mer and anti-CD68) and three (PNA, anti-Mer and anti-CD68) color overlay images are shown in the 4th and 5th column, respectively. The localization of Mer+ and CD68+ cells in the white (WP) and red (RP) pulp areas in B6 spleen (top row) are shown. Original magnification of images was 200×. Four to five mice of each genotype were used to generate these data.
Figure 8
Figure 8
Accumulation of TUNEL+ cells in GCs in the absence of Mer. (A) Three color immunohistology was performed on spleen tissues obtained on day 14 post NP-CGG immunization of B6 (top two rows) and Mer−/− (bottom row) mice. Spleen sections were stained with PNA (green, 1st column), anti-CD68 (red, 2nd column) and TUNEL (blue, 3rdcolumn). Two (anti-CD68 and TUNEL) and three (PNA, anti-CD68 and TUNEL) color overlay images are shown in the 4th and 5th column, respectively. (B) Similar analysis as in (A) was performed in which spleen sections were stained with PNA (green, 1st column), anti-CD21/35 (red, 2nd column) and TUNEL (blue, 3rd column). (C) TUNEL+ cells were counted in randomly picked GCs from four to five B6 (◯) and Mer−/− (◯) mice. (D) The number of CD68+ cells per GC was obtained by counting these cells in GCs described in panel (C). The average values for TUNEL+ and CD68+ cells per GC are shown in horizontal bars. Original magnification of images was 200×.

Similar articles

Cited by

References

    1. MacLennan IC. Germinal centers. Annu. Rev. Immunol. 1994;12:117–139. - PubMed
    1. Jacob J, Kelsoe G, Rajewsky K, Weiss U. Intraclonal generation of antibody mutants in germinal centres. Nature. 1991;354:389–392. - PubMed
    1. Berek C, Berger A, Apel M. Maturation of the immune response in germinal centers. Cell. 1991;67:1121–1129. - PubMed
    1. MacLennan IC, Gray D. Antigen-driven selection of virgin and memory B cells. Immunol. Rev. 1986;91:61–85. - PubMed
    1. Tarlinton D, Radbruch A, Hiepe F, Dorner T. Plasma cell differentiation and survival. Curr. Opin. Immunol. 2008;20:162–169. - PubMed

Publication types

MeSH terms

Substances