. 2010 Dec 1;29(23):4035-47.
doi: 10.1038/emboj.2010.258. Epub 2010 Oct 15.

Adhesion shapes T cells for prompt and sustained T-cell receptor signalling

Affiliations

Adhesion shapes T cells for prompt and sustained T-cell receptor signalling

Rita Lucia Contento et al. EMBO J. .

Abstract

During T-cell migration, cell polarity is orchestrated by chemokine receptors and adhesion molecules and involves the functional redistribution of molecules and organelles towards specific cell compartments. In contrast, it is generally believed that the cell polarity established when T cells meet antigen-presenting cells (APCs) is controlled by the triggered T-cell receptor (TCR). Here, we show that, during activation of human T lymphocytes by APCs, chemokines and LFA-1 establish cell polarity independently of TCR triggering. Chemokine-induced LFA-1 activation results in fast recruitment of MTOC and mitochondria towards the potential APC, a process required to amplify TCR Ca(2+) signalling at the upcoming immunological synapse, to promote nuclear translocation of transcriptional factor NFATc2 and boost CD25 expression. Our data show that the initial adhesive signals delivered by chemokines and LFA-1 shape and prepare T cells for antigen recognition.


Conflict of interest statement

The authors declare that they have no conflict of interest.

Figures

Figure 1
Figure 1
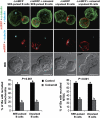
Mitochondria accumulate under the IS independently of TCR triggering. (A) Jurkat T cells stably expressing the mitochondrial marker mtRFP were incubated with SEE-loaded or unloaded B cells for 15 min. Images of mtRFP fluorescence from randomly selected conjugates (at least 180 for each condition, out of five independent experiments) were acquired, classified and analysed statistically as described in Materials and methods. Representative images of T cells with mitochondria recruited or not to the IS are shown in Supplementary Figure S1. Graph shows the quantitative analysis of mitochondria accumulation at the IS. Fluorescence (z projection of the stacks) and DIC representative images are shown. mtRFP was colour-coded red; α-tubulin, green. Bars, 10 μm. (B, C) Jurkat T cells expressing the mitochondrial marker mtRFP were plated with SEE-pulsed (B) or unpulsed (C) B cells and monitored by time-lapse microscopy for mitochondria relocation. Representative images taken from the digital movies (Supplementary Videos 2 and 3) at the indicated times are shown. Bars, 10 μm.
Figure 2
Figure 2
Mitochondria recruitment to the IS depends on LFA-1. Jurkat T cells stably expressing the mitochondrial marker mtRFP (A) or primary T cells transfected with mtRFP (B) were incubated with B cells, pre-pulsed or not with SEE (A) or superantigens (SAgs) (B), for 15 min. Where indicated, T cells were pre-treated with anti-LFA-1 neutralizing antibodies. Images from randomly selected conjugates (at least 149 for each condition, out of four (A) or two (B) independent experiments) were acquired, analysed and classified as described in Materials and methods. Graphs show the quantitative analysis of mitochondria accumulation at the IS. Data were statistically analysed as described in Materials and methods and columns with different letters are significantly different from each other. Fluorescence (z projection of the stacks) and DIC representative images are shown. mtRFP was colour-coded red; α-tubulin, green. Bars, 10 μm.
Figure 3
Figure 3
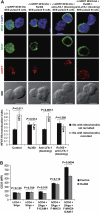
Mitochondria translocation requires LFA-1 triggering. (A, B) Jurkat T cells stably expressing mtRFP (A) or primary T cells transfected with mtRFP (B) were incubated for 15 min with murine L cells expressing, or not (F), human ICAM-1 (F-ICAM-1), ICAM-2 (F-ICAM-2), ICAM-3 (F-ICAM-3), MHC class II (F-MHCII) or MHC class II plus ICAM-1 (F-MHCII-ICAM-1). F-MHCII and F-MHCII-ICAM-1 were pre-pulsed or not with SEE (A) or superantigens (SAgs) (B). Images from randomly selected conjugates (at least 480 (A) or 69 (B) conjugates for each condition, out of three (A) or two (B) independent experiments) were acquired, analysed and classified as described in Materials and methods. Graphs show the quantitative analysis of mitochondria accumulation at the IS. (C, D) Jurkat T cells stably expressing mtRFP, pre-treated or not with 100 nM CXCL12 for 5 min, were plated for 15 min at 37°C on (C) microscope slides coated with 0.05 mg/ml poly-L-lysine or 20 μg/ml human ICAM-2/Fc or (D) borosilicate slides coated with 20 μg/ml blocking anti-LFA-1, activating anti-CD3 or activating anti-LFA-1 antibodies. (C, D) Randomly selected cells (at least 48 for each condition) were analysed by confocal microscopy. Graphs show the quantitative analysis of mitochondria translocation towards the slide. Fluorescence and DIC representative images are shown: lateral view (first and second row) and top view (third row) of three-dimensional reconstruction of the fluorescence stacks. mtRFP was colour-coded red; actin, green. Bars, 10 μm. (AD) All data were statistically analysed as described in Materials and methods and, in all graphs, columns with different letters are significantly different from each other.
Figure 4
Figure 4
Mitochondria recruitment to the IS depends on microtubule integrity. Jurkat T cells stably expressing the mitochondrial marker mtRFP were incubated with B cells, pre-pulsed or not with SEE, for 15 min. Where indicated, T cells were pre-treated with 10 μM colcemid. Images from randomly selected conjugates (at least 274 for each condition, out of two independent experiments) were acquired, analysed and classified as described in Materials and methods. Graphs show the quantitative analysis of mitochondria and MTOC recruitment to the IS. Data were statistically analysed as described in Materials and methods and columns with different letters are significantly different from each other. Fluorescence (z projection of the stacks) and DIC representative images are shown. mtRFP was colour-coded red; α-tubulin, green; γ-tubulin, cyan. Bars, 10 μm.
Figure 5
Figure 5
Mitochondria recruitment to the IS requires PI3K signalling. (A) Jurkat T cells stably expressing mtRFP were incubated with B cells, pre-pulsed or not with SEE, for 15 min. (B, C) Primary T cells transfected with mtRFP were incubated for 15 min with B cells (B) or murine L cells expressing human ICAM-1 (F-ICAM-1) or MHC class II plus ICAM-1 (F-MHCII-ICAM-1) (C), pre-pulsed or not with superantigens (SAgs). (D) Jurkat T cells stably expressing mtRFP were plated for 15 min at 37°C on borosilicate slides coated with 20 μg/ml activating anti-LFA-1 mAb or human ICAM-2/Fc (in this latter case, T cells were pre-treated for 5 min with 100 nM CXCL12). Where indicated, T cells were pre-treated with 1 μM wortmannin. Images from randomly selected conjugates or cells (at least 269 (A), 183 (B), 69 (C) conjugates or 44 (D) cells for each condition) were acquired, analysed and classified as described in Materials and methods. Graphs show the quantitative analysis of mitochondria accumulation at the IS. (AD) Fluorescence (z projection of the stacks) and DIC representative images are shown. mtRFP was colour-coded red; actin, green; α-tubulin, blue. Bars, 10 μm. (D) First and second rows show lateral view of three-dimensional reconstruction of the fluorescence stacks. (A, B) Data were statistically analysed as described in Materials and methods and columns with different letters are significantly different from each other. (C, D) Owing to the different types of stimuli (different APCs in (C), ICAM and mAb in (D)), wortmannin-treated cells were statistically compared (χ2 test) to their specific controls.
Figure 6
Figure 6
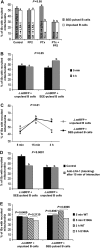
Different contribution of chemokine receptors and TCR to mitochondria recruitment to the IS. (A) Jurkat T cells stably expressing mtRFP, pre-treated or not with 1 μg/ml pertussis toxin and/or 50 μM PP2, were incubated with B cells pre-pulsed or not with SEE for 15 min. Text inside the graph bars indicates for each condition which signalling pathway (from TCR and/or chemokine receptors (CR)) is inducing LFA-1 activation. (B) Jurkat T cells stably expressing the mitochondrial marker mtRFP were incubated with SEE-loaded or unloaded B cells for 5 min or 3 h. (C) The graph condenses the kinetics of mitochondria translocation towards the IS in the presence or absence of TCR triggering. The statistical differences indicated by letters refer to each condition over time. (D) Jurkat T cells stably expressing mtRFP were incubated with B cells pre-pulsed or without SEE for 3 h. After 15 min of interaction, where indicated, anti-LFA-1-blocking antibodies were added. (E) Jurkat T cells stably expressing the mitochondrial marker mtRFP were transfected with CFP-ORAI1 or CFP-ORAI1-E106A and then incubated with SEE-loaded or unloaded B cells for 5 min or 3 h. Statistical differences between ORAI1 and ORAI1-E106A are indicated in the figure. (AE) Images from randomly selected conjugates (at least 120 (A), 359 (B), 140 (D) or 171 (E) for each condition) were acquired, analysed and classified as described in Materials and methods. Graph shows the quantitative analysis of mitochondria accumulation to the IS. Data were statistically analysed as described in Materials and methods and columns with different letters are significantly different from each other.
Figure 7
Figure 7
LFA-1-induced translocation of mitochondria to the IS amplifies TCR Ca2+ signalling. (AC) Free [Ca2+]i was measured by FACS in Fluo-4/Fura-Red-loaded Jurkat T cells conjugated with unpulsed B cells. SEE was added 5 min after conjugate formation. Ionomycin was used as positive control for the maximal Ca2+ influx. Where indicated, T cells were treated with anti-LFA-1 neutralizing antibodies and/or 50 μM ruthenium 360 or pertussis toxin (PTx). Data are representative of one out of three experiments. ‘Control' indicates Jurkat T cells analysed in the absence of B cells. The results are expressed as percentage of normalized response, calculated as indicated: [(mean of Fluo-4/Fura-Red ratio)−(mean of Fluo-4/Fura-Red ratio during T-cell stimulation with unpulsed B cells before SEE addition)]/[(mean of Fluo-4/Fura-Red ratio during the response to 1 μg/ml ionomycin)−(mean of Fluo-4/Fura-Red ratio during T-cell stimulation with unpulsed B cells before SEE addition)]. For each graph, the curves were statistically compared using two-way ANOVA, at three representative time points (indicated by standard error (s.e.) bars in the graphs). Curves with different letters are significantly different from each other at each time point. (D) Jurkat T cells expressing the mitochondrial marker mtRFP were plated with SEE-pulsed B cells and monitored by time-lapse microscopy for mitochondria relocation and calcium signalling. Representative images taken from the digital movies (Supplementary Video 7) at the indicated times are shown. Bars, 10 μm.
Figure 8
Figure 8
LFA-1, by recruiting mitochondria to the IS, sustains nuclear NFAT translocation and CD25 up-regulation. (A) Jurkat T cells were transfected with HA-NFATc2 and the mitochondrial marker mtRFP and then incubated with SEE-pulsed B cells for 15 min. Where indicated, T cells were pre-treated with anti-LFA-1-blocking antibodies and/or ruthenium 360. Images from randomly selected conjugates (at least 40 for each condition) were acquired, classified and analysed as described in Materials and methods. Numbers in the bars indicate the percentages of ISs with recruited mitochondria for each condition. Graph shows the quantitative analysis of NFAT-HA translocation to the nucleus (mean±s.e.). The NFAT-HA translocation index of unstimulated cells was 0.33±0.02 (mean±s.e.). Data were statistically analysed with Mann–Whitney test. The percentage of T cells with NFAT translocation index >0.66, considering all ISs independently of mitochondria position, was 43% (control), 26% (Ru360), 28% (anti-LFA-1) and 29% (Ru360+anti-LFA-1)). Fluorescence (z projection of the stacks for mitochondria and single slice for NFAT and DAPI) and DIC representative images are shown. mtRFP was colour-coded red; NFAT-HA, green; DAPI, blue. Bars, 10 μm. (B) Primary T cells were incubated for 18 h in the presence of superantigens (SAgs) with murine L cells expressing, or not (F), human ICAM-1 (F-ICAM-1), MHC class II (F-MHCII) or MHC class II plus ICAM-1 (F-MHCII-ICAM-1). Where indicated, T cells were pre-treated with ruthenium 360 and also incubated with APCs in the presence of ruthenium 360. Cells were then harvested, stained for CD4 and CD25 and analysed by FACS. Graph shows the mean fluorescence intensity (MFI) of CD25 (±s.d.). Statistical analysis was performed using Student's t-test.

Similar articles

Cited by

References

    1. Arimura N, Kaibuchi K (2005) Key regulators in neuronal polarity. Neuron 48: 881–884 - PubMed
    1. Barber DF, Faure M, Long EO (2004) LFA-1 contributes an early signal for NK cell cytotoxicity. J Immunol 173: 3653–3659 - PubMed
    1. Barnard AL, Igakura T, Tanaka Y, Taylor GP, Bangham CR (2005) Engagement of specific T-cell surface molecules regulates cytoskeletal polarization in HTLV-1-infected lymphocytes. Blood 106: 988–995 - PubMed
    1. Barreiro O, de la Fuente H, Mittelbrunn M, Sanchez-Madrid F (2007) Functional insights on the polarized redistribution of leukocyte integrins and their ligands during leukocyte migration and immune interactions. Immunolog Rev 218: 147–164 - PubMed
    1. Bewick V, Cheek L, Ball J (2004) Statistics review 8: qualitative data—tests of association. Crit Care (London, England) 8: 46–53 - PMC - PubMed

Publication types

MeSH terms