. 2010 Dec 1;29(23):3967-78.
doi: 10.1038/emboj.2010.261. Epub 2010 Oct 15.

A phospho/methyl switch at histone H3 regulates TFIID association with mitotic chromosomes

Affiliations

A phospho/methyl switch at histone H3 regulates TFIID association with mitotic chromosomes

Radhika A Varier et al. EMBO J. .

Abstract

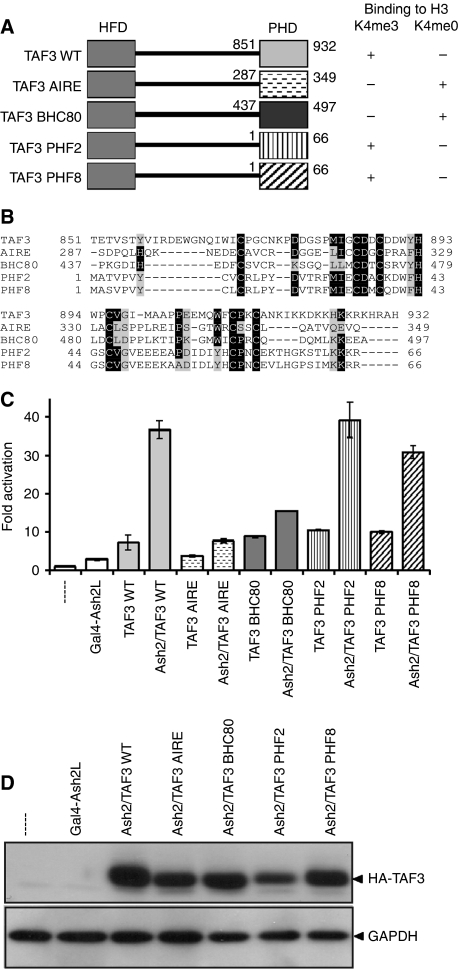
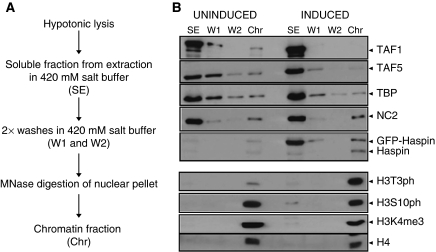
Histone methylation patterns are correlated with eukaryotic gene transcription. High-affinity binding of the plant homeodomain (PHD) of TFIID subunit TAF3 to trimethylated lysine-4 of histone H3 (H3K4me3) is involved in promoter recruitment of this basal transcription factor. Here, we show that for transcription activation the PHD of TAF3 can be replaced by PHDs of other high-affinity H3K4me3 binders. Interestingly, H3K4me3 binding of TFIID and the TAF3-PHD is decreased by phosphorylation of the adjacent threonine residue (H3T3), which coincides with mitotic inhibition of transcription. Ectopic expression of the H3T3 kinase haspin repressed TAF3-mediated transcription of endogenous and of reporter genes and decreased TFIID association with chromatin. Conversely, immunofluorescence and live-cell microscopy studies showed an increased association of TFIID with mitotic chromosomes upon haspin knockdown. Based on our observations, we propose that a histone H3 phospho-methyl switch regulates TFIID-mediated transcription during mitotic progression of the cell cycle.


Conflict of interest statement

The authors declare that they have no conflict of interest.

Figures

Figure 1
Figure 1
Transcriptional activation mediated by PHD of H3K4me3 binders. (A) Schematic representation of TAF3 chimeric constructs with the PHD of TAF3 swapped for the PHD of AIRE, BHC80, PHF2 or PHF8. Binding preferences of the PHDs for histone H3 tail is tabulated. (B) Alignment of the PHDs of TAF3, AIRE, BHC80, PHF2 and PHF8. (C) U2OS cells were transfected in triplicates with 100 ng 5XGal4MLP-luc, 250 ng TK-Renilla-luc, 50 ng Gal4-Ash2L and 500 ng of either pMT2-HA-TAF3 or TAF3 chimeric constructs. Cell lysates were prepared, and relative luciferase activity was determined. The graph represents the fold activation relative to the transfection with Gal4-DBD alone. (D) Expression of the various PHD constructs in (C) is depicted as probed by HA antibody, and GAPDH serves as the loading control.
Figure 2
Figure 2
Effect of HFD and linker regions on TAF3 function. (A) Domain representation of the TAF3 deletion constructs. (B) The experiment was done as in Figure 1C except that cells were transfected with 100 ng 5XGal4MLP-luc, 250 ng TK-Renilla-luc and different TAF3 constructs at various concentrations to obtain similar expression levels either in the presence or absence of 50 ng Gal4-Ash2L. (C) Expression of the various TAF3 constructs in (B) is depicted as probed by HA antibody. The asterisk indicates detection of a background band. (D) Lysates from transfected cells overexpressing wild type or TAF3 deletion constructs were incubated with streptavidin beads coated with the indicated H3 peptides. Bound proteins were analysed by SDS–PAGE separation followed by immunoblotting. For comparison, 10% of the input was analysed in parallel. (E) U2OS cells were transfected in triplicates with pcDNA, wild-type TAF3 and the mutant and deletion constructs. RNA was extracted from these cells and quantitative RT–PCR analysis was performed. The graph represents levels of different mRNA normalized to β-actin and then further expressed as expression relative to the lane with pcDNA control transfection. (F) Expression of the various TAF3 constructs in (E) is depicted as probed by HA antibody. The asterisk indicates detection of a background band.
Figure 3
Figure 3
Phosphorylation of histone H3T3 antagonizes binding of H3K4me3 readers. (A) Nuclear extract was incubated with streptavidin beads coated with the indicated H3 peptides. Bound proteins were analysed by SDS–PAGE separation followed by immunoblotting. For comparison, 10% of the input was analysed in parallel. (B) Same as in (A) except that lysates from transfected cells overexpressing TAF3 WT, Δ100 or Δ251–932 were used for binding. (C) Bacterial lysates containing GST-TAF3 were incubated in increasing amounts with streptavidin beads coated with the indicated H3 peptides. Bound proteins were analysed by Coomassie staining. Arrows indicate position of the GST-fusion protein. Amount in the input lane corresponds to the midpoint in the titration of GST-TAF3 lysate. (D) Dissociation constants of TAF3-PHD binding to either only K4me3 modified or a K4me3 and T3ph doubly modified H3 peptide (residues 1–17) as determined by tryptophan fluorescence. (E) Pull downs were performed as in (A) using bacterial lysates containing GST-TAF3, GST-BPTF, GST-ING2 or GST-ING4.
Figure 4
Figure 4
Histone H3T3 kinase haspin represses TAF3-mediated transcription activation. (A) U2OS cells were transfected in triplicates with 100 ng 5XGal4MLP-luc, 100 ng TK-Renilla-luc, 50 ng Gal4-Ash2L, 500 ng pMT2-HA-TAF3 and 50 ng of either wild type (WT) or kinase-dead mutant (KD) of myc-haspin. Cell lysates were prepared, and relative luciferase activity was determined. The graph represents the fold activation relative to the transfection with Gal4-Ash2L. (B) Protein expression of transfected HA-TAF3 and haspin constructs in (A) were analysed by SDS–PAGE followed by immunoblotting. H3T3ph levels were probed as a read out of haspin kinase function and histone H4 served as a loading control. (C) 293T cells were seeded in DMEM without phenol red containing 5% dextran-coated, charcoal-treated serum and transfected with 250 ng 5XGal4TK-Luc, 25 ng CMV Renilla-luc, 50 ng Gal4-ERα, 500 ng pMT2-HA-TAF3 and 50 ng of either wild type or kinase-dead mutant of haspin. At 24 h after transfection, the medium was changed to medium containing either the ligand 10 nmol/l 17 h estradiol (E2; Sigma), or the vehicle–ethanol. The graph represents the fold activation relative to the transfection with Gal4-ERα in the presence of E2. (D) Transient transfection luciferase assay was performed as in Figure 4A except that Gal4-Ash2L was replaced by Gal4-E2F. The graph represents the fold activation relative to the transfection with Gal4-E2F.
Figure 5
Figure 5
Haspin represses TAF3 activation of endogenous genes. (A, B) U2OS cells were transfected in triplicates with pcDNA, TAF3 and wild type or kinase-dead haspin. RNA was extracted from these cells and quantitative RT–PCR analysis was performed. The graph represents the levels of different mRNA normalized to β-actin and then further expressed as expression relative to the lane with pcDNA control transfection. (C) Protein expression of transfected HA-TAF3 and haspin constructs were analysed by SDS–PAGE followed by immunoblotting. H3T3ph levels were probed as a read out of haspin kinase function and α-tubulin served as a loading control.
Figure 6
Figure 6
TFIID dissociates from chromatin upon haspin expression. (A) Schematic representation of chromatin fractionation. (B) SE, W1, W2 and Chr fractions obtained from either haspin expression induced or uninduced cells were analysed by immunoblotting to detect transcription factors, haspin or histone modifications in the various fractions.
Figure 7
Figure 7
TFIID association with mitotic chromosomes increases upon haspin knockdown. (A) U2OS-GFP-TAF5 cells transfected with either non-targeting control siRNA (left panels) or haspin siRNA (right panels) and cotransfected with H2B-dsRed were released from an 18-h thymidine synchronization and subjected to overnight video microscopy at 37°C. Images were collected every 2 min. Selected images are shown as combined panels of GFP fluorescence (green) on the left, and on the right, the GFP signal is shown superimposed on corresponding H2B-dsRed images. The entire series is available in the Supplementary Movie section. From different experiments, 129 out of 151 cells that divided during the filming showed an exclusion of TAF5 from mitotic chromatin, and 79 out of 124 cells retained TAF5 on chromatin upon haspin knockdown. Different siRNAs against haspin gave similar results. (B) U2OS-GFP-TAF5 cells with either a non-targeting control siRNA transfection (left panel) or haspin siRNA-mediated knockdown (right panel) were labelled with indicated antibodies and viewed under the confocal microscope to look for association or exclusion of TAF5 from the mitotic chromosomes. DAPI stained condensed DNA and H3T3ph stained chromosomes served as indicators for cells in various stages of mitosis. At least 70% of cells that were formaldehyde fixed during various mitotic phases exhibited a similarity in the pattern of mitotic exclusion or non-exclusion of TAF5. In all, 99 of the 129 mitotic cells showed an exclusion of TAF5 from mitotic chromatin and 78 out of 125 mitotic cells retained TAF5 on chromatin upon haspin knockdown. Different siRNAs against haspin gave similar results. Scale bar is 10 μm. (C) U2OS-GFP-TAF5 cells treated with Aurora B inhibitor ZM447439 or hesperadin (data not shown) for 2 h prior to fixation were screened for any effects on TAF5 localization due to a decrease in H3S10ph status. In all, 23 out of 27 mitotic cells showed exclusion of TAF5 from mitotic chromatin upon inhibition of Aurora B kinase. Scale bar is 10 μm. (D) The ratio of chromosomal versus cytoplasmic-specific staining of TAF5 in (B, C) is quantified for 10 cells each and represented as a graph.

References

    1. Bereczki O, Ujfaludi Z, Pardi N, Nagy Z, Tora L, Boros IM, Balint E (2008) TATA binding protein associated factor 3 (TAF3) interacts with p53 and inhibits its function. BMC Mol Biol 9: 57. - PMC - PubMed
    1. Bernstein BE, Kamal M, Lindblad-Toh K, Bekiranov S, Bailey DK, Huebert DJ, McMahon S, Karlsson EK, Kulbokas EJ III, Gingeras TR, Schreiber SL, Lander ES (2005) Genomic maps and comparative analysis of histone modifications in human and mouse. Cell 120: 169–181 - PubMed
    1. Bhattacharya S, Takada S, Jacobson RH (2007) Structural analysis and dimerization potential of the human TAF5 subunit of TFIID. Proc Natl Acad Sci U S A 104: 1189–1194 - PMC - PubMed
    1. Blobel GA, Kadauke S, Wang E, Lau AW, Zuber J, Chou MM, Vakoc CR (2009) A reconfigured pattern of MLL occupancy within mitotic chromatin promotes rapid transcriptional reactivation following mitotic exit. Mol Cell 36: 970–983 - PMC - PubMed
    1. Christova R, Oelgeschlager T (2002) Association of human TFIID-promoter complexes with silenced mitotic chromatin in vivo. Nat Cell Biol 4: 79–82 - PubMed

Publication types

MeSH terms