

Age-Related Differences in Functional Nodes of the Brain Cortex - A High Model Order Group ICA Study
- PMID: 20953235
- PMCID: PMC2955419
- DOI: 10.3389/fnsys.2010.00032
Age-Related Differences in Functional Nodes of the Brain Cortex - A High Model Order Group ICA Study
Abstract
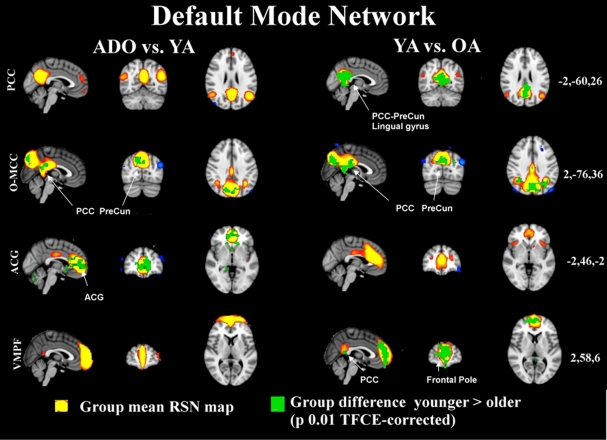
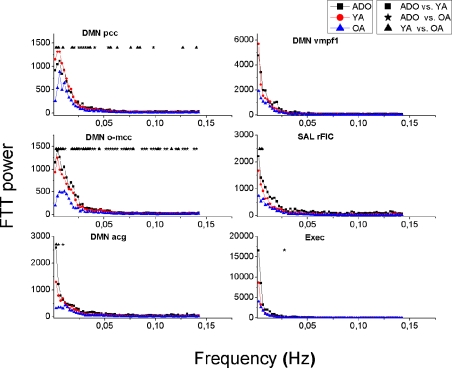
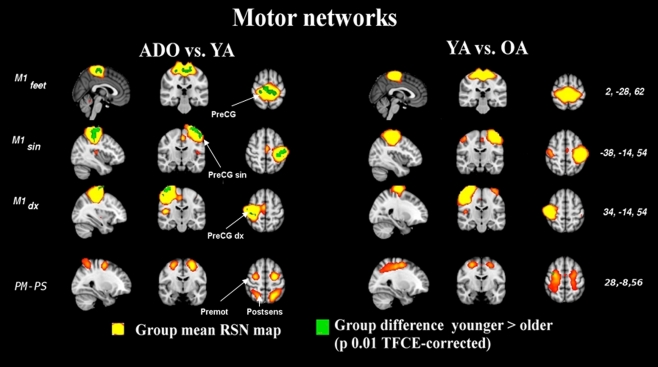
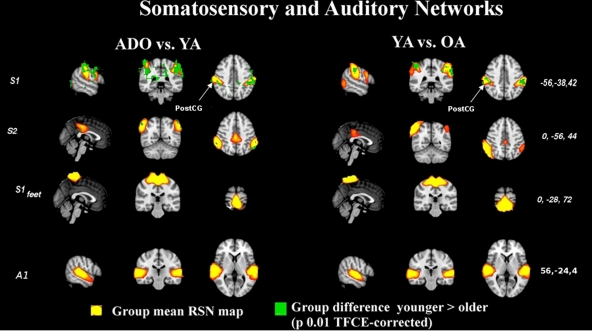
Functional MRI measured with blood oxygen dependent (BOLD) contrast in the absence of intermittent tasks reflects spontaneous activity of so-called resting state networks (RSN) of the brain. Group level independent component analysis (ICA) of BOLD data can separate the human brain cortex into 42 independent RSNs. In this study we evaluated age-related effects from primary motor and sensory, and, higher level control RSNs. One hundred sixty-eight healthy subjects were scanned and divided into three groups: 55 adolescents (ADO, 13.2 ± 2.4 years), 59 young adults (YA, 22.2 ± 0.6 years), and 54 older adults (OA, 42.7 ± 0.5 years), all with normal IQ. High model order group probabilistic ICA components (70) were calculated and dual-regression analysis was used to compare 21 RSN's spatial differences between groups. The power spectra were derived from individual ICA mixing matrix time series of the group analyses for frequency domain analysis. We show that primary sensory and motor networks tend to alter more in younger age groups, whereas associative and higher level cognitive networks consolidate and re-arrange until older adulthood. The change has a common trend: both spatial extent and the low frequency power of the RSN's reduce with increasing age. We interpret these result as a sign of normal pruning via focusing of activity to less distributed local hubs.
Keywords: age; blood oxygen dependent; functional magnetic resonance imaging; hub; independent component analysis; networks; resting state.
Figures


Similar articles
-
Functional segmentation of the brain cortex using high model order group PICA.Hum Brain Mapp. 2009 Dec;30(12):3865-86. doi: 10.1002/hbm.20813. Hum Brain Mapp. 2009. PMID: 19507160 Free PMC article.
-
Non-linear ICA Analysis of Resting-State fMRI in Mild Cognitive Impairment.Front Neurosci. 2018 Jun 19;12:413. doi: 10.3389/fnins.2018.00413. eCollection 2018. Front Neurosci. 2018. PMID: 29970984 Free PMC article.
-
Alcohol increases spontaneous BOLD signal fluctuations in the visual network.Neuroimage. 2010 Nov 1;53(2):534-43. doi: 10.1016/j.neuroimage.2010.06.061. Epub 2010 Jun 28. Neuroimage. 2010. PMID: 20600963
-
Spatiotemporal dynamics of the brain at rest--exploring EEG microstates as electrophysiological signatures of BOLD resting state networks.Neuroimage. 2012 May 1;60(4):2062-72. doi: 10.1016/j.neuroimage.2012.02.031. Epub 2012 Feb 22. Neuroimage. 2012. PMID: 22381593
-
Mapping cognitive and emotional networks in neurosurgical patients using resting-state functional magnetic resonance imaging.Neurosurg Focus. 2020 Feb 1;48(2):E9. doi: 10.3171/2019.11.FOCUS19773. Neurosurg Focus. 2020. PMID: 32006946 Free PMC article. Review.
Cited by
-
ICA-based artifact removal diminishes scan site differences in multi-center resting-state fMRI.Front Neurosci. 2015 Oct 27;9:395. doi: 10.3389/fnins.2015.00395. eCollection 2015. Front Neurosci. 2015. PMID: 26578859 Free PMC article.
-
Concordance of the Resting State Networks in Typically Developing, 6-to 7-Year-Old Children and Healthy Adults.Front Hum Neurosci. 2017 Apr 25;11:199. doi: 10.3389/fnhum.2017.00199. eCollection 2017. Front Hum Neurosci. 2017. PMID: 28487641 Free PMC article.
-
Functional connectivity tracks clinical deterioration in Alzheimer's disease.Neurobiol Aging. 2012 Apr;33(4):828.e19-30. doi: 10.1016/j.neurobiolaging.2011.06.024. Epub 2011 Aug 16. Neurobiol Aging. 2012. PMID: 21840627 Free PMC article.
-
Altered resting-state activity in seasonal affective disorder.Hum Brain Mapp. 2014 Jan;35(1):161-72. doi: 10.1002/hbm.22164. Epub 2012 Sep 15. Hum Brain Mapp. 2014. PMID: 22987670 Free PMC article.
-
Introduction to special topic - resting-state brain activity: implications for systems neuroscience.Front Syst Neurosci. 2010 Aug 11;4:37. doi: 10.3389/fnsys.2010.00037. eCollection 2010. Front Syst Neurosci. 2010. PMID: 20941326 Free PMC article. No abstract available.
References
-
- Biswal B. B., Mennes M., Zuo X. N., Gohel S., Kelly C., Smith S. M., Beckmann C. F., Adelstein J. S., Buckner R. L., Colcombe S., Dogonowski A. M., Ernst M., Fair D., Hampson M., Hoptman M. J., Hyde J. S., Kiviniemi V. J., Kötter R., Li S. J., Lin C. P., Lowe M. J., Mackay C., Madden D. J., Madsen K. H., Margulies D. S., Mayberg H. S., McMahon K., Monk C. S., Mostofsky S. H., Nagel B. J., Pekar J. J., Peltier S. J., Petersen S. E., Riedl V., Rombouts S. A., Rypma B., Schlaggar B. L., Schmidt S., Seidler R. D., Siegle G. J., Sorg C., Teng G. J., Veijola J., Villringer A., Walter M., Wang L., Weng X. C., Whitfield-Gabrieli S., Williamson P., Windischberger C., Zang Y. F., Zhang H. Y., Castellanos F. X., Milham M. P. (2010). Toward discovery science of human brain function. Proc. Natl. Acad. Sci. USA 107, 4734–473910.1073/pnas.0911855107 - DOI - PMC - PubMed
LinkOut - more resources
Full Text Sources
Miscellaneous