

Nitric oxide synthase enzymes in the airways of mice exposed to ovalbumin: NOS2 expression is NOS3 dependent
- PMID: 20953358
- PMCID: PMC2952819
- DOI: 10.1155/2010/321061
Nitric oxide synthase enzymes in the airways of mice exposed to ovalbumin: NOS2 expression is NOS3 dependent
Abstract
Objectives and design: The function of the airway nitric oxide synthase (NOS) isoforms and the lung cell types responsible for its production are not fully understood. We hypothesized that NO homeostasis in the airway is important to control inflammation, which requires upregulation, of NOS2 protein expression by an NOS3-dependent mechanism.
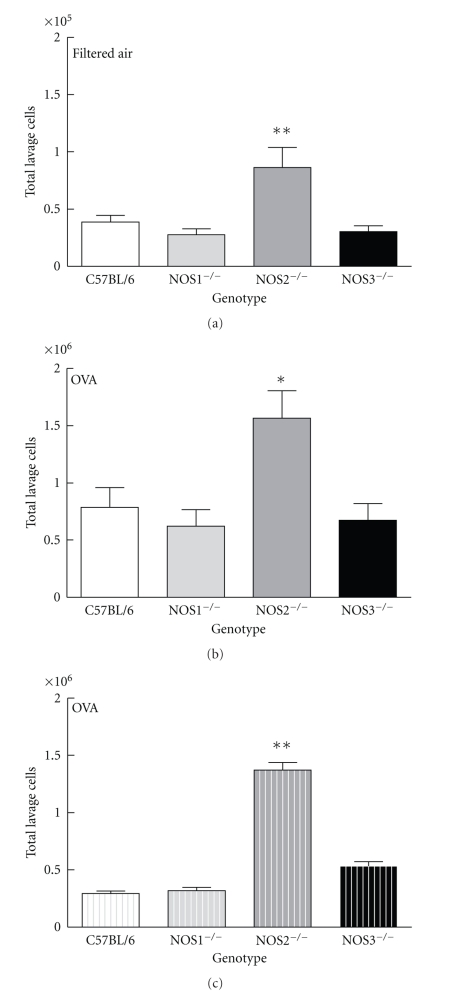
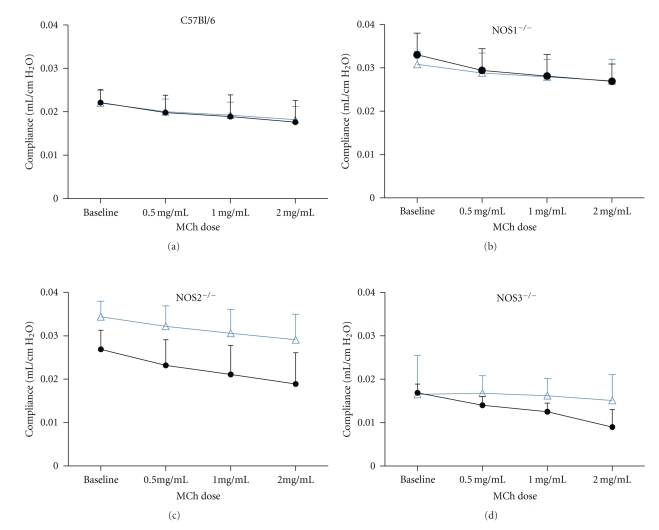
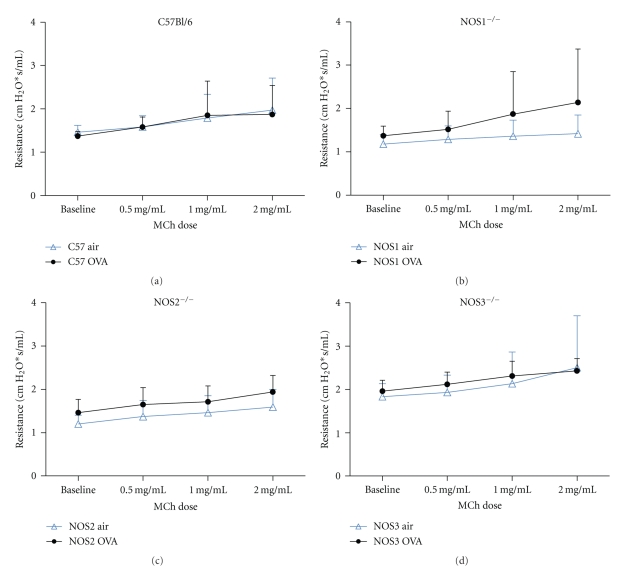
Materials or subjects: Mice from a C57BL/6 wild-type, NOS1(-/-), NOS2(-/-), and NOS3(-/-) genotypes were used. All mice strains were systemically sensitized and exposed to filtered air or ovalbumin (OVA) aerosol for two weeks to create a subchronic model of allergen-induced airway inflammation.
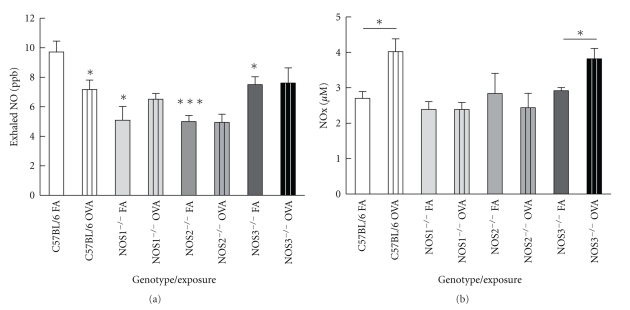
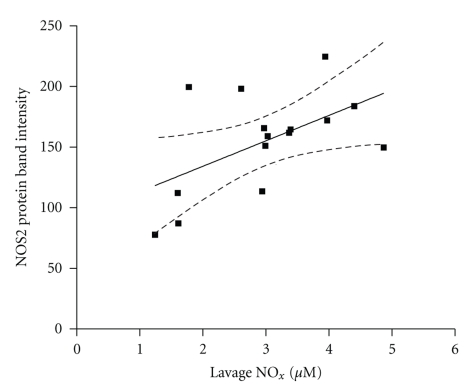
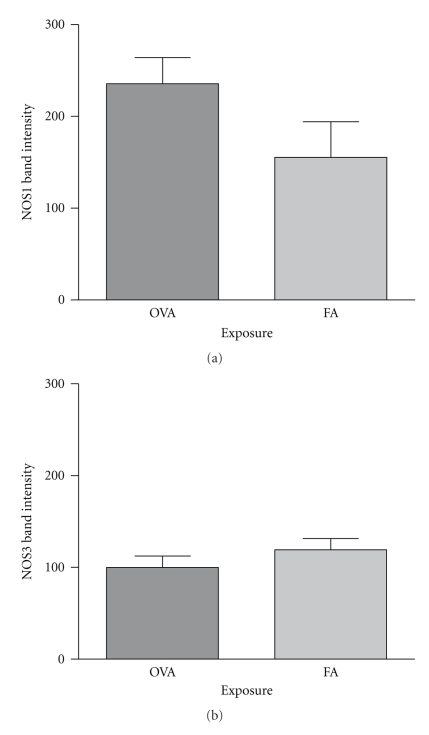
Methods: We measured lung function, lung lavage inflammatory and airway epithelial goblet cell count, exhaled NO, nitrate and nitrite concentration, and airway NOS1, NOS2, and NOS3 protein content.
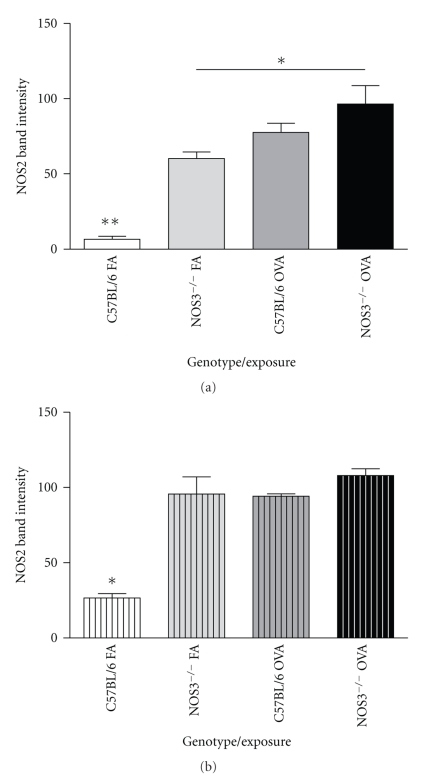
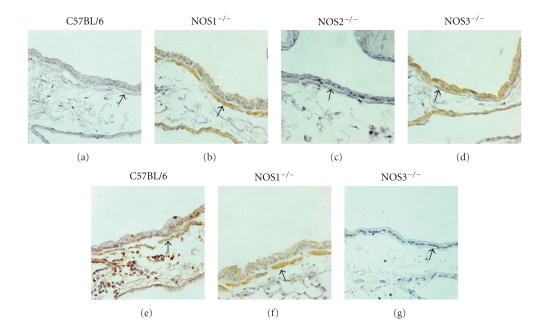
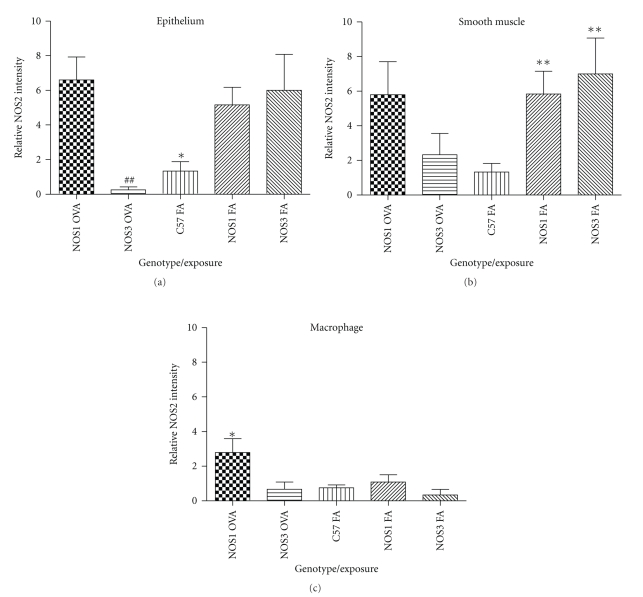
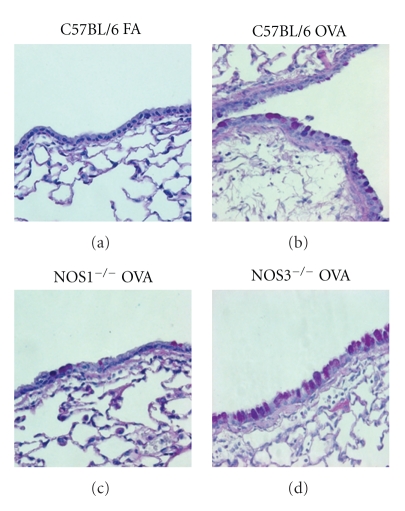
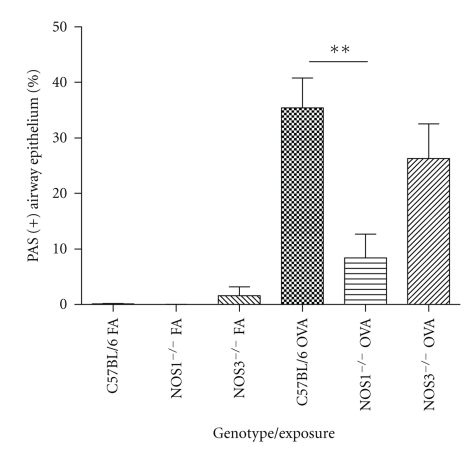
Results: Deletion of NOS1 or NOS3 increases NOS2 protein present in the airway epithelium and smooth muscle of air-exposed animals. Exposure to allergen significantly reduced the expression of NOS2 protein in the airway epithelium and smooth muscle of the NOS3(-/-) strain only. This reduction in NOS2 expression was not due to the replacement of epithelial cells with goblet cells as remaining epithelial cells did not express NOS2. NOS1(-/-) animals had significantly reduced goblet cell metaplasia compared to C57Bl/6 wt, NOS2(-/-), and NOS3(-/-) allergen-exposed mice.
Conclusion: The airway epithelial and smooth muscle cells maintain a stable airway NO concentration under noninflammatory conditions. This "homeostatic" mechanism is unable to distinguish between NOS derived from the different constitutive NOS isoforms. NOS3 is essential for the expression of NOS2 under inflammatory conditions, while NOS1 expression contributes to allergen-induced goblet cell metaplasia.
Figures
Similar articles
-
Arginase inhibition in airways from normal and nitric oxide synthase 2-knockout mice exposed to ovalbumin.Toxicol Appl Pharmacol. 2010 Jan 1;242(1):1-8. doi: 10.1016/j.taap.2009.09.018. Epub 2009 Oct 2. Toxicol Appl Pharmacol. 2010. PMID: 19800904 Free PMC article.
-
Arginase enzymes in isolated airways from normal and nitric oxide synthase 2-knockout mice exposed to ovalbumin.Toxicol Appl Pharmacol. 2009 Feb 1;234(3):273-80. doi: 10.1016/j.taap.2008.10.007. Epub 2008 Nov 5. Toxicol Appl Pharmacol. 2009. PMID: 19027033 Free PMC article.
-
The spinal cord expression of neuronal and inducible nitric oxide synthases and their contribution in the maintenance of neuropathic pain in mice.PLoS One. 2010 Dec 13;5(12):e14321. doi: 10.1371/journal.pone.0014321. PLoS One. 2010. PMID: 21179208 Free PMC article.
-
Association between polymorphisms of NOS1, NOS2 and NOS3 genes and suicide behavior: a systematic review and meta-analysis.Metab Brain Dis. 2019 Aug;34(4):967-977. doi: 10.1007/s11011-019-00406-3. Epub 2019 Mar 21. Metab Brain Dis. 2019. PMID: 30900130
-
The Role of Single-Nucleotide Variants of NOS1, NOS2, and NOS3 Genes in the Comorbidity of Arterial Hypertension and Tension-Type Headache.Molecules. 2021 Mar 12;26(6):1556. doi: 10.3390/molecules26061556. Molecules. 2021. PMID: 33809023 Free PMC article. Review.
Cited by
-
Nitric oxide in cellular adaptation and disease.Redox Biol. 2020 Jul;34:101550. doi: 10.1016/j.redox.2020.101550. Epub 2020 Apr 25. Redox Biol. 2020. PMID: 32438317 Free PMC article. Review.
-
Imaging mouse lung allograft rejection with (1)H MRI.Magn Reson Med. 2015 May;73(5):1970-8. doi: 10.1002/mrm.25313. Epub 2014 Jun 20. Magn Reson Med. 2015. PMID: 24954886 Free PMC article.
-
Competitive metabolism of L-arginine: arginase as a therapeutic target in asthma.J Biomed Res. 2011 Sep;25(5):299-308. doi: 10.1016/S1674-8301(11)60041-9. J Biomed Res. 2011. PMID: 23554705 Free PMC article.
-
Novel therapeutic strategies for adult obese asthmatics.Immunol Allergy Clin North Am. 2014 Nov;34(4):809-23. doi: 10.1016/j.iac.2014.07.006. Epub 2014 Aug 29. Immunol Allergy Clin North Am. 2014. PMID: 25282293 Free PMC article. Review.
-
NOS1 methylation and carotid artery intima-media thickness in children.Circ Cardiovasc Genet. 2014 Apr;7(2):116-22. doi: 10.1161/CIRCGENETICS.113.000320. Epub 2014 Mar 12. Circ Cardiovasc Genet. 2014. PMID: 24622112 Free PMC article.
References
-
- Kenyon NJ, Gohil K, Last JA. Susceptibility to ovalbumin-induced airway inflammation and fibrosis in inducible nitric oxide synthetase-deficient mice: mechanisms and consequences. Toxicology and Applied Pharmacology. 2003;191(1):2–11. - PubMed
-
- Kenyon NJ, Last JA. Reversible and irreversible airway inflammation and fibrosis in mice exposed to inhaled ovalbumin. Inflammation Research. 2005;54(2):57–65. - PubMed
-
- Kobayashi K, Nishimura Y, Yamashita T, Nishiuma T, Satouchi M, Yokoyama M. The effect of overexpression of endothelial nitric oxide synthase on eosinophilic lung inflammation in a murine model. International Immunopharmacology. 2006;6(7):1040–1052. - PubMed
-
- Shan J, Carbonara P, Karp N, Tulic M, Hamid Q, Eidelman DH. Localization and distribution of NOS1 in murine airways. Nitric Oxide - Biology and Chemistry. 2007;17(1):25–32. - PubMed
