. 2010:2010:398026.
doi: 10.1155/2010/398026. Epub 2010 Sep 30.

Effect of feeding status on adjuvant arthritis severity, cachexia, and insulin sensitivity in male Lewis rats

Affiliations

Effect of feeding status on adjuvant arthritis severity, cachexia, and insulin sensitivity in male Lewis rats

Andrea Stofkova et al. Mediators Inflamm. 2010.

Abstract

We studied the effect of food restriction, overfeeding, and normofeeding on cachexia, inflammatory and metabolic parameters, and insulin sensitivity in chronic adjuvant arthritis (AA) in rats. Food restriction during AA increased circulating ghrelin, corticosterone, decreased leptin, and ameliorated arthrogram score and systemic inflammation compared to normofeeding. Overfeeding worsened arthrogram score and systemic inflammation, and led to lipid accumulation in the liver, but not to alterations of adipokine and ghrelin plasma levels relative to normofeeding. Independently of feeding status, AA induced cachexia, in which modulation of mRNA expressions for appetite-regulating neuropeptides (NPY, AgRP, POMC, CART) in the arcuate nucleus (ARC) does not play a primary role. The overexpression of IL-1β mRNA in the ARC suggests its role in the mechanisms of impaired energy balance during AA under all feeding conditions. Normal HOMA index in all arthritic groups does not indicate the development of insulin resistance by feeding interventions in these rats.


Figures

Figure 1
Figure 1
Body mass (a) and food intake (b) in control rats on standard diet (CN  = ▲), high-fat diet (SHF  =  ■), and food restriction (FR  = ♦), and in arthritic rats on standard diet (AA-N  =  ∆), high-fat diet (AA-SHF  =  □), and food restriction (AA-FR =  ) in selected days after cFA inoculation. Values for food intake are presented as means of 2 cages (4 rats per cage). Statistical significance between the body mass values in arthritic rats and their corresponding controls on the same dietary regime: *P < .05, **P < .01, ***P < .001. Significant difference between AA-N and AA-SHF: P < .05. First day of significant differences: CN versus SHF × P < .05, FR versus CN a P < .05, FR versus SHF b P < .001, AA-FR versus AA-N ### P < .001, and AA-FR versus AA-SHF +++ P < .001. Effects of dietary interventions on the severity of arthritis expressed by arthrogram score (c). Significant difference between AA-FR and AA-N: *P < .05, ***P < .001; significant difference between AA-FR and AA-SHF: +++ P < .001; significant difference between AA-SHF and AA-N: P < .05.
Figure 2
Figure 2
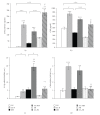
Plasma corticosterone (a), plasma CRP (b), IL-1β mRNA expression (c), and CRP mRNA expression (d) in the liver of healthy control (CN, SHF, FR) and arthritic rats (AA-N, AA-SHF, AA-FR) measured on day 18 after cFA inoculation. Results of mRNA expressions are expressed in arbitrary units as the ratio of given mRNA to GAPDH. Significant differences between healthy controls on different dietary regime: × P < .05, ××× P < .001. Statistical significances: control rats versus arthritic rats on the same dietary regime *P < .05, **P < .01, ***P < .001; AA-FR versus AA-N # P < .05, ### P < .001; AA-FR versus AA-SHF ++ P < .01; AA-SHF versus AA-N †† P < .01. For abbreviations see Figure 1.
Figure 3
Figure 3
Plasma leptin (a), adiponectin (b), visfatin (c) and (d) ghrelin levels in healthy control (CN, SHF, FR) and arthritic rats (AA-N, AA-SHF, AA-FR) on day 18 after cFA inoculation. Significant differences between healthy controls on different dietary regime: × P < .05, ××× P < .001. Significant differences between control rats and arthritic rats on the same dietary regime: **P < .01, ***P < .001. Significant differences between dietary modulated arthritic groups: # P < .05, ## P < .01 (AA-FR versus AA-N); ++ P < .01 (AA-FR versus AA-SHF). For abbreviations see Figure 1.
Figure 4
Figure 4
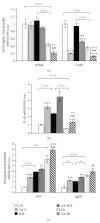
Anorexigenic (a) and orexigenic (c) neuropeptide and IL-1β (b) mRNA expressions in the ARC in healthy control (CN, SHF, FR) and arthritic rats (AA-N, AA-SHF, AA-FR) on day 18 after cFA inoculation. Results are expressed in arbitrary units as the ratio of given mRNA to 18S rRNA. Significant differences between healthy controls on different dietary regime: × P < .05, ×× P < .01, ××× P < .001. Significant differences between control rats and arthritic rats on the same dietary regime: *P < .05, **P < .01, ***P < .001. Significant differences between arthritic groups: ## P < .01, ### P < .001 (AA-FR versus AA-N); ++ P < .01, +++ P < .001 (AA-FR versus AA-SHF); †† P < .01, ††† P < .001 (AA-SHF versus AA-N). For abbreviations see Figure 1.
Figure 5
Figure 5
Basal plasma levels of glucose (a) and insulin (b), HOMA index (c), and liver concentrations of triglycerides (d) and cholesterol (e) in healthy controls (CN, SHF, FR) and arthritic rats (AA-N, AA-SHF, AA-FR) on day 18 after cFA inoculation. Results are expressed as means ± SEM. Significant difference between healthy controls on different dietary regime: × P < .05. Significant differences between control rats and arthritic rats on the same dietary regime: *P < .05, **P < .01, ***P < .001. Other statistical differences: AA-FR versus AA-N # P < .05, ### P < .001; AA-FR versus AA-SHF + P < .05, ++ P < .01; AA-SHF versus AA-N †† P < .01. For abbreviations see Figure 1.

Similar articles

Cited by

References

    1. Bays HE, González-Campoy JM, Bray GA, et al. Pathogenic potential of adipose tissue and metabolic consequences of adipocyte hypertrophy and increased visceral adiposity. Expert Review of Cardiovascular Therapy. 2008;6(3):343–368. - PubMed
    1. Bartfai T, Waalen J, Buxbaum JN. Adipose tissue as a modulator of clinical inflammation: does obesity reduce the prevalence of rheumatoid arthritis? Journal of Rheumatology. 2007;34(3):488–492. - PubMed
    1. Summers GD, Deighton CM, Rennie MJ, Booth AH. Rheumatoid cachexia: a clinical perspective. Rheumatology. 2008;47(8):1124–1131. - PubMed
    1. Van Der Helm-van Mil AHM, Van Der Kooij SM, Allaart CF, Toes REM, Huizinga TWJ. A high body mass index has a protective effect on the amount of joint destruction in small joints in early rheumatoid arthritis. Annals of the Rheumatic Diseases. 2008;67(6):769–774. - PubMed
    1. Young HR, Solus J, Sokka T, et al. Adipocytokines are associated with radiographic joint damage in rheumatoid arthritis. Arthritis and Rheumatism. 2009;60(7):1906–1914. - PMC - PubMed

Publication types