

Anticancer Potential of Aqueous Ethanol Seed Extract of Ziziphus mauritiana against Cancer Cell Lines and Ehrlich Ascites Carcinoma
- PMID: 20953391
- PMCID: PMC2952327
- DOI: 10.1155/2011/765029
Anticancer Potential of Aqueous Ethanol Seed Extract of Ziziphus mauritiana against Cancer Cell Lines and Ehrlich Ascites Carcinoma
Abstract
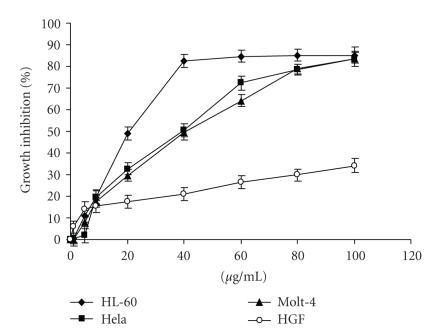
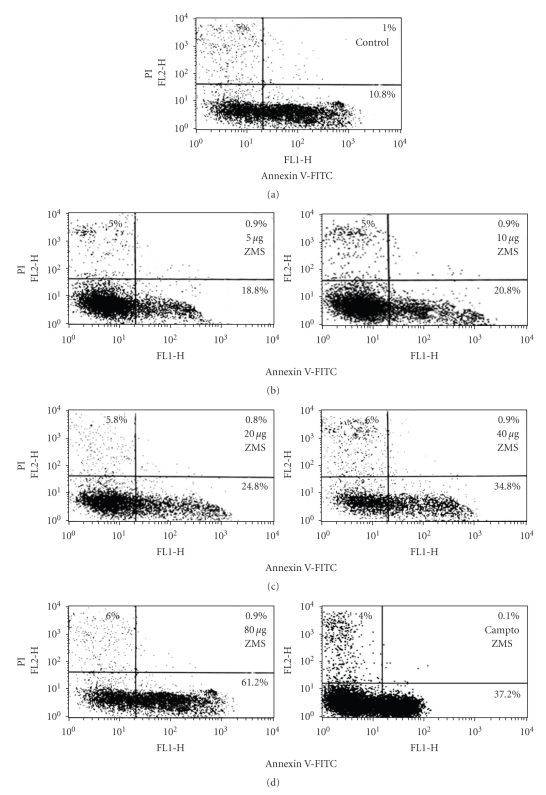
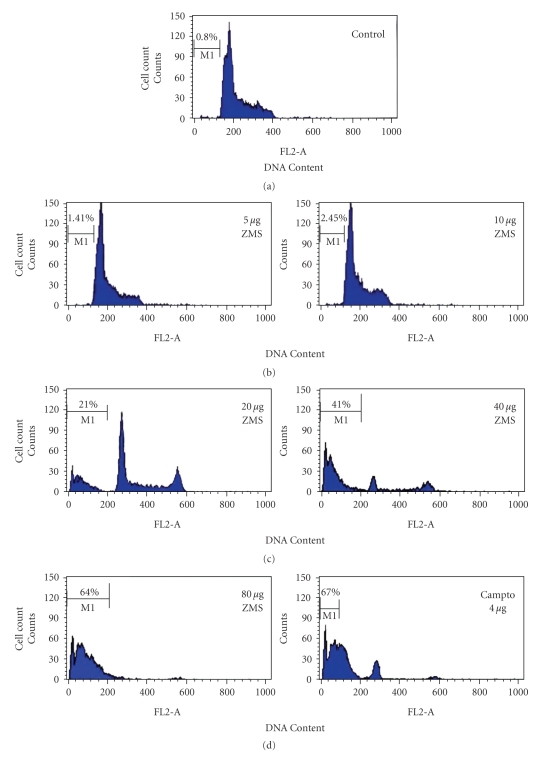
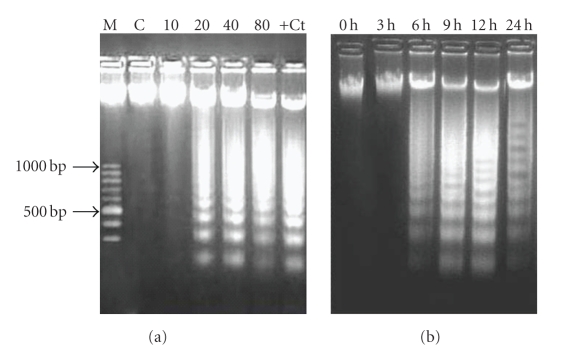
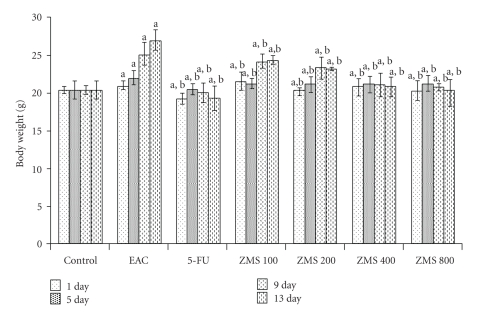
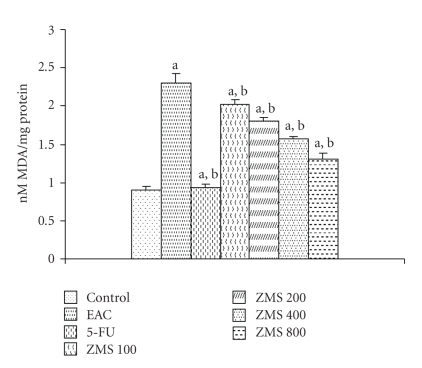
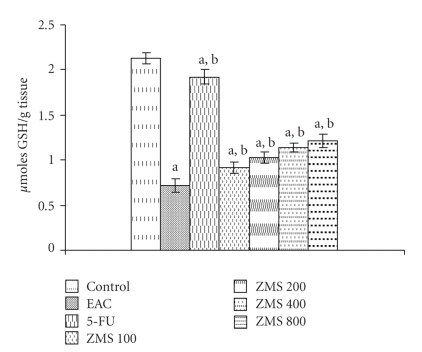
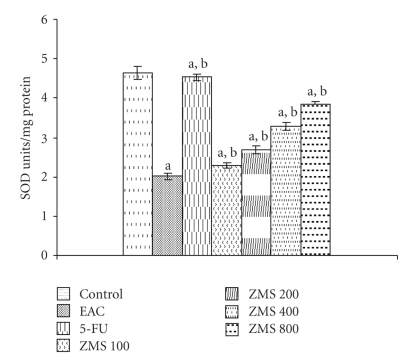
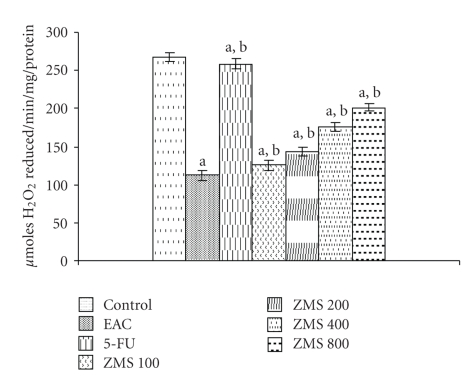
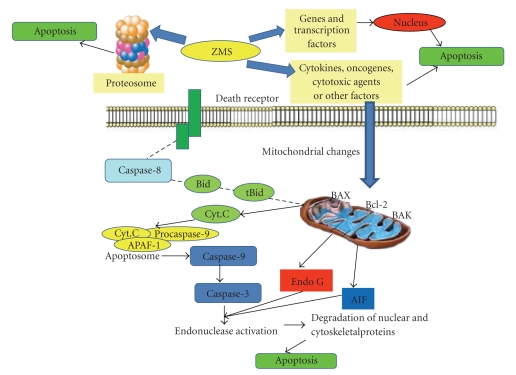
Ziziphus mauritiana (Lamk.) is a fruit tree that has folkloric implications against many ailments and diseases. In the present study, anticancer potential of seed extract of Ziziphus mauritiana in vitro against different cell lines (HL-60, Molt-4, HeLa, and normal cell line HGF) by MTT assay as well as in vivo against Ehrich ascites carcinoma bearing Swiss albino mice was investigated. The extract was found to markedly inhibit the proliferation of HL-60 cells. Annexin and PI binding of treated HL-60 cells indicated apoptosis induction by extract in a dose-dependent manner. The cell cycle analysis revealed a prominent increase in sub Go population at concentration of 20 μg/ml and above. Agarose gel electrophoresis confirmed DNA fragmentation in HL-60 cells after 3 h incubation with extract. The extract also exhibited potent anticancer potential in vivo. Treatment of Ehrlich ascites carcinoma bearing Swiss albino mice with varied doses (100-800 mg/kg b.wt.) of plant extract significantly reduced tumor volume and viable tumor cell count and improved haemoglobin content, RBC count, mean survival time, tumor inhibition, and percentage life span. The enhanced antioxidant status in extract-treated animals was evident from decline in levels of lipid peroxidation and increased levels of glutathione, catalase, and superoxide dismutase.
Figures
Similar articles
-
Evaluation of in vitro antioxidant, anticancer and in vivo antitumour activity of Termitomyces clypeatus MTCC 5091.Pharm Biol. 2016 Nov;54(11):2536-2546. doi: 10.3109/13880209.2016.1168854. Epub 2016 May 25. Pharm Biol. 2016. PMID: 27225970
-
Antitumor activity of the methanolic extract of Ammannia baccifera L. against Dalton's ascites lymphoma induced ascitic and solid tumors in mice.J Ethnopharmacol. 2012 Jun 26;142(1):305-9. doi: 10.1016/j.jep.2012.05.008. Epub 2012 May 14. J Ethnopharmacol. 2012. PMID: 22613234
-
Evaluation of Antitumor and Antioxidant Activity of Melothria heterophylla (Lour.) Cogn.Indian J Pharm Sci. 2013 Sep;75(5):515-22. Indian J Pharm Sci. 2013. PMID: 24403651 Free PMC article.
-
Evaluation of anticancer activity of ethanol extract of Sesbania grandiflora (Agati Sesban) against Ehrlich ascites carcinoma in Swiss albino mice.J Ethnopharmacol. 2011 Apr 12;134(3):984-7. doi: 10.1016/j.jep.2011.01.012. Epub 2011 Jan 18. J Ethnopharmacol. 2011. PMID: 21251969
-
Antineoplastic activities of MT81 and its structural analogue in Ehrlich ascites carcinoma-bearing Swiss Albino mice.Oxid Med Cell Longev. 2010 Jan-Feb;3(1):61-70. doi: 10.4161/oxim.3.1.10495. Oxid Med Cell Longev. 2010. PMID: 20716929 Free PMC article.
Cited by
-
Integration of medicinal plants into the traditional system of medicine for the treatment of cancer in Sokoto State, Nigeria.Heliyon. 2020 Sep 2;6(9):e04830. doi: 10.1016/j.heliyon.2020.e04830. eCollection 2020 Sep. Heliyon. 2020. PMID: 32939417 Free PMC article.
-
Antitumor activity of ethanolic extract of Dendrobium formosum in T-cell lymphoma: an in vitro and in vivo study.Biomed Res Int. 2014;2014:753451. doi: 10.1155/2014/753451. Epub 2014 May 18. Biomed Res Int. 2014. PMID: 24959588 Free PMC article.
-
Ziziphus nummularia Attenuates the Malignant Phenotype of Human Pancreatic Cancer Cells: Role of ROS.Molecules. 2021 Jul 15;26(14):4295. doi: 10.3390/molecules26144295. Molecules. 2021. PMID: 34299570 Free PMC article.
-
Selection of superior genotypes of Indian jujube (Ziziphus mauritiana Lamk.) as revealed by fruit-related traits.Food Sci Nutr. 2022 Jan 17;10(3):903-913. doi: 10.1002/fsn3.2721. eCollection 2022 Mar. Food Sci Nutr. 2022. PMID: 35311171 Free PMC article.
-
Effects of curine in HL-60 leukemic cells: cell cycle arrest and apoptosis induction.J Nat Med. 2015 Apr;69(2):218-23. doi: 10.1007/s11418-014-0881-5. Epub 2015 Jan 24. J Nat Med. 2015. PMID: 25616501
References
-
- Gonzales GF, Valerio LG., Jr. Medicinal plants from Peru: a review of plants as potential agents against cancer. Anti-Cancer Agents in Medicinal Chemistry. 2006;6(5):429–444. - PubMed
-
- Rafter JJ. Scientific basis of biomarkers and benefits of functional foods for reduction of disease risk: cancer. British Journal of Nutrition. 2002;88(2):S219–S224. - PubMed
-
- Madhusudan S, Middleton MR. The emerging role of DNA repair proteins as predictive, prognostic and therapeutic targets in cancer. Cancer Treatment Reviews. 2005;31(8):603–617. - PubMed
-
- Mignogna MD, Fedele S, Lo Russo L. The World cancer report and the burden of oral cancer. European Journal of Cancer Prevention. 2004;13(2):139–142. - PubMed
-
- Morton J. Indian jujube. In: Mortan JF, Miami FL, editors. Fruits of Warm Climates. Lafayette, Ind, USA: Center for New Crops & Plant Products, Purdue University; 1987. pp. 272–275. http://www.hort.purdue.edu/newcrop/morton/indian_jujube.html.
LinkOut - more resources
Full Text Sources
Other Literature Sources
Research Materials
Miscellaneous
