. 2011:2011:532180.
doi: 10.1155/2011/532180. Epub 2010 Sep 26.

Oral Treatment with Extract of Agaricus blazei Murill Enhanced Th1 Response through Intestinal Epithelial Cells and Suppressed OVA-Sensitized Allergy in Mice

Affiliations

Oral Treatment with Extract of Agaricus blazei Murill Enhanced Th1 Response through Intestinal Epithelial Cells and Suppressed OVA-Sensitized Allergy in Mice

Go Bouike et al. Evid Based Complement Alternat Med. 2011.

Abstract

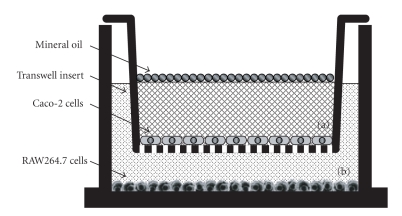
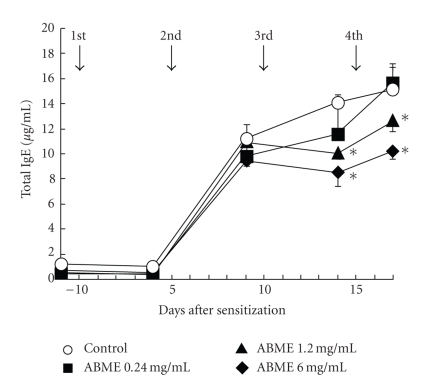
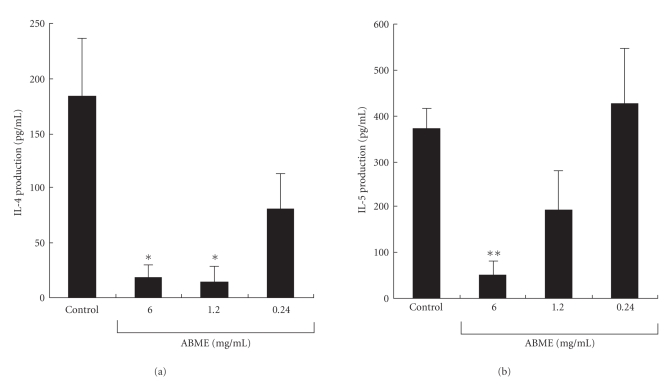
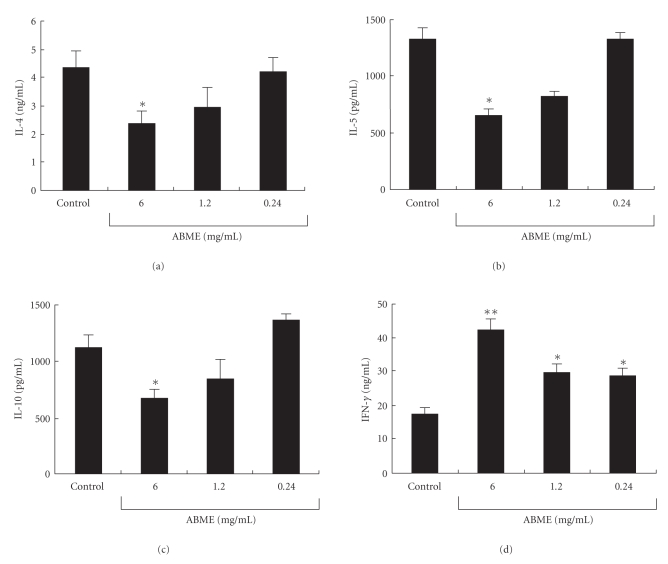
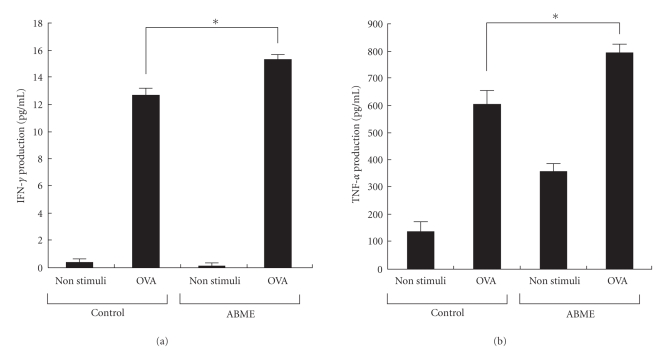
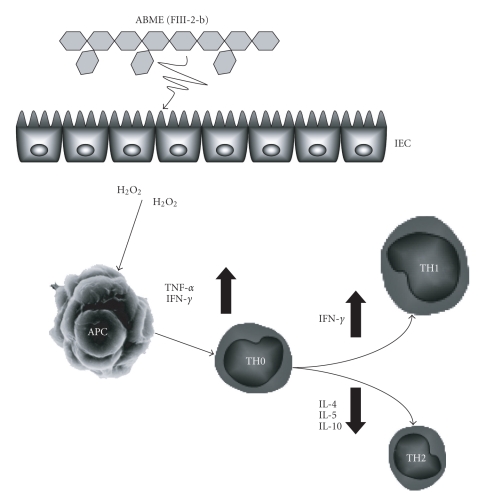
To clarify the mechanism of the antiallergic activity of Agaricus blazei Murill extract (ABME), the present paper used an in vivo allergy model and an in vitro intestinal gut model. During OVA sensitization, the serum IgE levels decreased significantly in ABME group. Interleukin (IL)-4 and -5 produced from OVA-restimulated splenocytes was significantly decreased, and anti-CD3ε/CD28 antibody treatment also reduced IL-10, -4, and -5 production and increased IFN-γ production in ABME group. These results suggest that oral administration of ABME improves Th1/Th2 balance. Moreover, a coculture system constructed of Caco-2 cells and splenocytes from OT-II mice or RAW 264.7 cells indicated that the significant increases in IFN-γ production by ABME treatment. Therefore, it was concluded that the antiallergic activity of ABME was due to the activation of macrophages by epithelial cells and the promotion of the differentiation of naïve T cells into Th1 cells in the immune.


Figures

Figure 1
Figure 1
In vitro intestinal gut model constructed with Caco-2 cells in apical compartment (a) and RAW264.7 cells in basolateral compartment (b). Transwell inserts on which Caco-2 cells had been cultured were inserted into multiple plate wells containing RAW264.7 cells. Mineral oil (50 μl/well) was added to the surface of the apical compartment (a) to mimic anaerobic conditions.
Figure 2
Figure 2
Effects of ABME on the passive cutaneous anaphylaxis reaction in the ears of BALB/c mice. BALB/c mice were given 0.048, 0.24, 1.2, or 6.0 mg/ml ABME in their drinking water, and passive cutaneous anaphylaxis (PCA) was induced as described in Materials and Methods. Edema was measured before and after PiCl challenge. Values represent the means ± S.E. of 4 mice in each group. *P < .05, significantly different from the values of the control group.
Figure 3
Figure 3
Effect of ABME on OVA sensitization in BALB/c mice The arrows show the days corresponding to the injections of OVA. Serum was obtained from each mouse on the day before each OVA injection, and the level of total IgE was determined by ELISA. Values represent the means ± S.E. of 5 mice in each group. *P < .05, significantly different from the values of the control group.
Figure 4
Figure 4
Effect of ABME on the production of the Th2 cytokines IL-4 and 5 from antigen-restimulated splenocytes in OVA-sensitized mice. Two days after the last OVA injection, the spleen cells isolated from each mouse were restimulated with 25 μg/ml OVA. After incubation at 37oC for 72 h, the levels of IL-4 (a) and IL-5 (b) in the culture supernatants were determined using a cytometric bead array immunoassay. Values represent the means ± S.E. of 5 mice in each group.*P < .05,**P < .01, significantly different from the values of the control group.
Figure 5
Figure 5
Effect of ABME on the cytokine profile of anti-CD3ε/CD28 antibody-stimulated splenocytes in OVA-sensitized mice. Spleen cells from the mice of each group were stimulated with 5 μg/ml each of anti-CD3ε/28 antibody at 37°C for 48 h. After incubation, the IL-4 (a), IL-5 (b), IL-10 (c), and IFN-γ (d) in the culture medium were determined using a cytometric bead array immunoassay. Values represent the means ± S.E. of 5 mice in each group.*P < .05,**P < .01, significantly different from the values of the control group.
Figure 6
Figure 6
Effect of ABME on INF-γ and TNF-α production from OVA-stimulated splenocytes prepared from OT-II mice via Caco-2 cells using a coculture system. Splenocytes were cultured in 24-wells plates for 2 h in 5% CO2 and incubated at 37°C to precipitate cells on the bottom of the plates. Then, the transwell inserts on which the Caco-2 cells had been cultured were placed into the 24 well plates, which had been preloaded with splenocytes. Two hundred microliters of ABME (250 μg/ml) were applied to the apical side and incubated for 3h. After incubation, the inserts were removed, and the splenocytes were restimulated with 10 μg/ml OVA at 37°C in a CO2 incubator for 72 h. After incubation, the culture media were collected for the measurement of IFN-γ (a) and TNF-α (b) contents as described in Materials and Methods. Values represent the means ± SE. (n = 3). *P < .05, significantly different from the values of the control group.
Figure 7
Figure 7
TNF-α and NO production in the coculture system or RAW264.7 cells alone treated with ABME or LPS ABME or LPS was added into the apical compartment of the Caco-2/RAW264.7 coculture system (a, c) or added directly into the RAW264.7 cells alone (b, d) and was then incubated for 12 h. After incubation, the supernatants were collected. TNF-α and NO secretion into the culture supernatant (basolateral compartment) was determined by a cytotoxicity assay and Griess reagent. Values represent the means ± SE. (n = 3). *P < .05, significantly different from the values of the control group.
Figure 8
Figure 8
Effect of anti-FIII-2-b antibody on TNF-α production induced by ABME in a coculture system. Anti-FIII-2-b antibody or isotype IgG1 (25 ml/well) were incubated with ABME for 2 h and centrifuged at 7000rpm for 5 minutes. The supernatant was added to the apical compartment of the Caco-2/RAW264.7 co-culture system for 3 h. After the incubation, the supernatant from the basolateral side was collected, and TNF-α content was measured using a killing assay. Values represent the means ± S.E. (n = 3). *P < .05 and **P < .05, significantly different from the values for FIII-2-b and ABME treatment, respectively.
Figure 9
Figure 9
Shift in Th1/Th2 balance to Th1 by ABME through intestinal epithelial cells. An intestinal epithelial cell is stimulated by FIII-2-b in ABME, which binds to a certain receptor. This stimulus produces second messengers, likely H2O2. Macrophages result in enhancement of TNF-α and IFN-γ production. Produced INF-γ affects Th1/Th2 balance which is important for allergy, and promotes the negative regulation of IL-4, 5, 10 which induce Th2 cell dominance, resulting in Th1 cell dominance in immune system.

Similar articles

Cited by

References

    1. Yunginger JW. Anaphylaxis. Annals of Allergy. 1992;62:87–96. - PubMed
    1. Sampson HA. Update on food allergy. Journal of Allergy and Clinical Immunology. 2004;113(5):805–819. - PubMed
    1. Asher MI, Stephan M, Bengt B, Christopher KWL, David PT, Stephan KW. Worldwide time trends in the prevalence of symptoms of asthma, allergic rhinoconjunctivitis, and eczema in childhood: ISAAC Phases One and Three repeat multicountry cross-sectional surveys. The Lancet. 2006;368(9537):733–743. - PubMed
    1. Ebina T, Fujimiya Y. Antitumor effect of a peptide-glucan preparation extracted from agaricus blazei in a double-grafted tumor system in mice. Biotherapy. 1998;11(4):259–265. - PubMed
    1. Ito H, Shimura K, Itoh H, Kawade M. Antitumor effects of a new polysaccharide-protein complex (ATOM) prepared from Agaricus blazei (Iwade strain 101) “Himematsutake” and its mechanisms in tumor-bearing mice. Anticancer Research. 1997;17:277–284. - PubMed

LinkOut - more resources