. 2011 Sep;33(3):363-76.
doi: 10.1007/s11357-010-9191-3. Epub 2010 Oct 16.

Age-associated impaired plasmacytoid dendritic cell functions lead to decreased CD4 and CD8 T cell immunity

Affiliations

Age-associated impaired plasmacytoid dendritic cell functions lead to decreased CD4 and CD8 T cell immunity

Aishwarya Sridharan et al. Age (Dordr). 2011 Sep.

Abstract

Increased susceptibility to infections, particularly respiratory viral infections, is a hallmark of advancing age. The underlying mechanisms are not well understood, and there is a scarcity of information regarding the contribution of the innate immune system, which is the first line of defense against infections. In the present study, we have investigated the effect of advancing age on plasmacytoid dendritic cell (PDC) function because they are critical in generating a robust antiviral response via the secretion of interferons (IFN). Our results indicate that PDCs from the aged are impaired in their capacity to secrete IFN-I in response to influenza virus and CPG stimulation. Additionally, we observed a severe reduction in the production of IFN-III, which plays an important role in defense against viral infections at respiratory mucosal surfaces. This reduction in IFN-I and IFN-III were a result of age-associated impaired phosphorylation of transcription factor, IRF-7. Furthermore, aged PDCs were observed to be impaired in their capacity to induce perforin and granzyme in CD8 T cells. Comparison of the antigen-presenting capacity of aged PDC with young PDC revealed that PDCs from aged subjects display reduced capacity to induce proliferation and IFN-gamma secretion in CD4 and CD8 T cells as compared with PDCs from young subjects. In summary, our study demonstrates that advancing age has a profound effect on PDC function at multiple levels and may therefore, be responsible for the increased susceptibility to infections in the elderly.


Figures
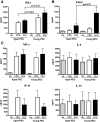
Fig. 1
Fig. 1
PDCs from aged subjects are impaired in their capacity to secrete IFN-I and IFN-III. Purified PDCs from aged and young subjects were stimulated with CPG or heat-killed influenza (Flu). Cytokine secretion was determined after overnight stimulation. a Bar diagram depicts the level of type I IFN secretion by aged and young PDCs. b Bar diagram depicts the level of type III IFN secretion by aged and young PDCs. c Bar diagrams depict the levels of TNF-α, IL-6, IL-10, and IP-10 secretion by aged and young PDCs. Figure is mean ±SE of 25 different aged and young subjects
Fig. 2
Fig. 2
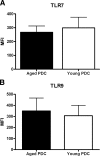
The expression of TLR7 and TLR9 in PDCs are comparable between aged and young subjects. Intracellular expression of TLRs 7 and 9 was determined by flow cytometry. a Bar diagram depicts the mean fluorescence intensities (MFI) of TLR7 in aged and young PDCs. b Bar diagram depicts the mean fluorescence intensities (MFI) of TLR9 in aged and young PDCs. Figure is mean ±SE of 12 different aged and young subjects
Fig. 3
Fig. 3
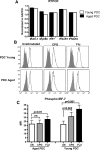
Phosphorylation of IRF-7 is impaired in PDCs from aged subjects. a Bar diagram depicts the ratio of IRAK-1, MyD88, IRF-7, IFNAR1, and IFNAR2 to GAPDH in PDCs from aged and young as determined by real-time PCR. b Histograms denote the phosphorylation of IRF-7 at 30 min in unstimulated and CPG and influenza (Flu)-stimulated aged and young PDCs. Figure is representative of 12 similar experiments. Solid grey histograms depict the isotype; black lined histogram is the experimental group. c Bar graph depicts the mean fluorescence intensity (MFI) minus the isotype MFI of Phospho IRF-7 30 min post-stimulation with CPG and influenza. Figure is mean ±SE of 12 different aged and young subjects
Fig. 4
Fig. 4
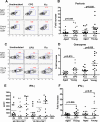
PDCs from aged are impaired in their capacity to prime cytotoxic CD8 T lymphocyte responses. a Contour plot depicts the intracellular expression of perforin in CD8 T cells co-cultured with aged and young PDCs stimulated with CPG and influenza (Flu). Figure is representative of 15 such experiments. b Graph depicts the fold induction of perforin in CD8 T cells cultured with CPG or influenza-stimulated aged and young PDCs compared with unstimulated PDCs. Figure is mean ±SE of 15 different aged and young subjects. Each dot corresponds to one separate subject. c Contour plot depicts the intracellular expression of granzyme in CD8 T cells co-cultured with aged and young PDCs stimulated with CPG and influenza (Flu). Figure is representative of 15 such experiments. d Graph depicts the fold induction of granzyme in CD8 T cells cultured with CPG or influenza stimulated aged and young PDCs compared with unstimulated PDCs. Figure is mean ±SE of 15 different aged and young subjects. Each dot corresponds to one separate subject. e Graph depicts the levels of IFN-γ in the supernatant of aged and young PDC-CD8 coculture on stimulation with CPG and influenza (Flu). f Graph depicts the fold induction of IFN-γ in CD8 T cells cultured with CPG or influenza-stimulated aged and young PDCs compared with unstimulated PDCs. Figure is mean ±SE of 15 different aged and young subjects. Each dot corresponds to one separate subject
Fig. 5
Fig. 5
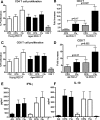
PDCs from aged are impaired in their capacity to prime CD4 and CD8 T cell responses. a Bar graph depicts the percentage of CD4 T cells proliferating after culture with CPG and influenza stimulated aged and young PDCs. b Bar graph depicts the fold induction of proliferation in CD4 T cells cultured with CPG or influenza-stimulated aged and young PDCs compared with unstimulated PDCs. c Bar graph depicts the percentage of CD8 T cells proliferating after culture with CPG and influenza-stimulated aged and young PDCs. d Bar graph depicts the fold induction of proliferation in CD8 T cells cultured with CPG or influenza stimulated aged and young PDCs compared with unstimulated PDCs. e Bar graph depicts the level of IFN-γ secreted by T cells. f Bar graph depicts the level of IL-10 secreted by T cells Figure is mean ±SE of 12 different aged and young subjects

Similar articles

Cited by

References

    1. Agrawal A, Agrawal S, Cao JN, Su H, Osann K, Gupta S. Altered innate immune functioning of dendritic cells in elderly humans: a role of the phosphoinositide 3-kinase-signaling pathway. J Immunol. 2007;178(11):6912–6922. - PubMed
    1. Almeida GM, de Oliveira DB, Magalhaes CL, Bonjardim CA, Ferreira PC, Kroon EG. Antiviral activity of type I interferons and interleukins 29 and 28a (type III interferons) against Apeu virus. Antiviral Res. 2008;80(3):302–308. doi: 10.1016/j.antiviral.2008.06.016. - DOI - PubMed
    1. Ank N, West H, Bartholdy C, Eriksson K, Thomsen AR, Paludan SR. Lambda interferon (IFN-lambda), a type III IFN, is induced by viruses and IFNs and displays potent antiviral activity against select virus infections in vivo. J Virol. 2006;80(9):4501–4509. doi: 10.1128/JVI.80.9.4501-4509.2006. - DOI - PMC - PubMed
    1. Ank N, Iversen MB, Bartholdy C, Staeheli P, Hartmann R, Jensen UB, Dagnaes-Hansen F, Thomsen AR, Chen Z, Haugen H, Klucher K, Paludan SR. An important role for type III interferon (IFN-λ/IL-28) in TLR-induced antiviral activity. J Immunol. 2008;180(4):2474–2485. - PubMed
    1. Bartlett NW, Buttigieg K, Kotenko SV, Smith GL. Murine interferon λs (type III interferons) exhibit potent antiviral activity in vivo in a poxvirus infection model. J Gen Virol. 2005;86(Pt 6):1589–1596. doi: 10.1099/vir.0.80904-0. - DOI - PubMed

Publication types