. 2011 Jan;136(1):20-34.
doi: 10.1016/j.actpsy.2010.09.006. Epub 2010 Oct 16.

Dissecting the clock: understanding the mechanisms of timing across tasks and temporal intervals

Affiliations

Dissecting the clock: understanding the mechanisms of timing across tasks and temporal intervals

Ashley S Bangert et al. Acta Psychol (Amst). 2011 Jan.

Abstract

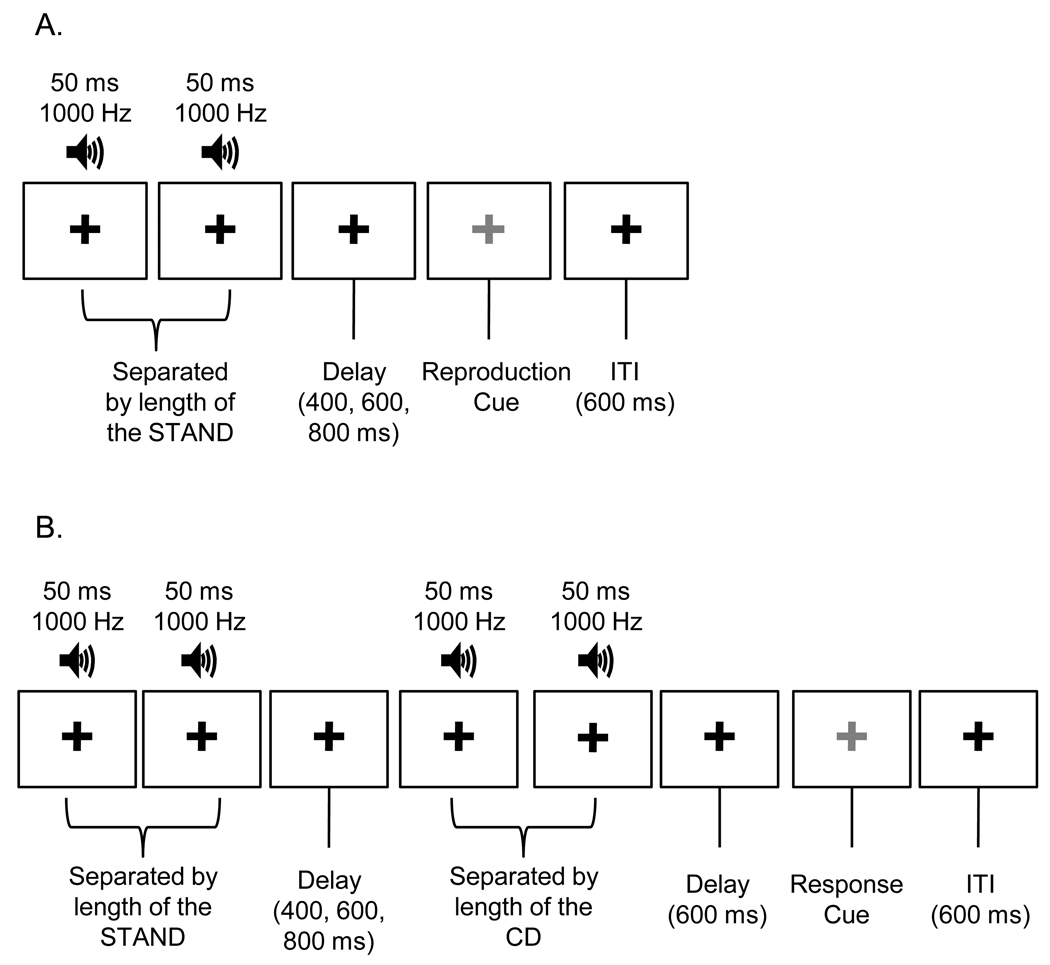
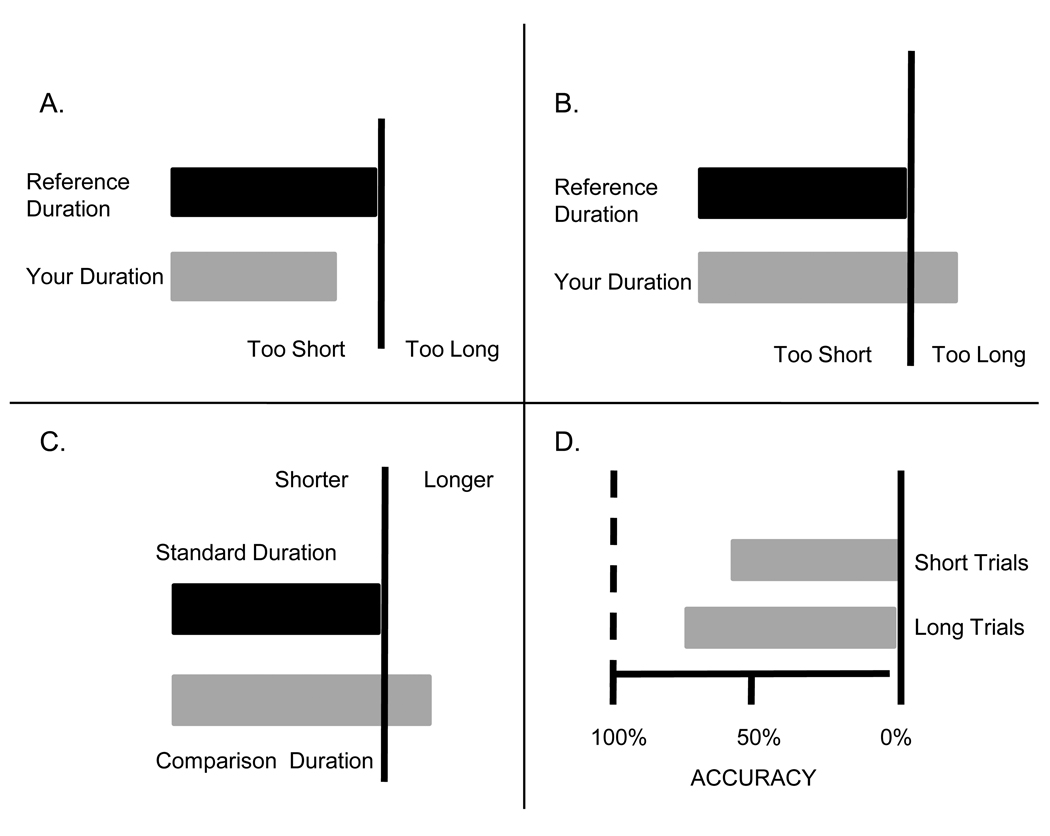
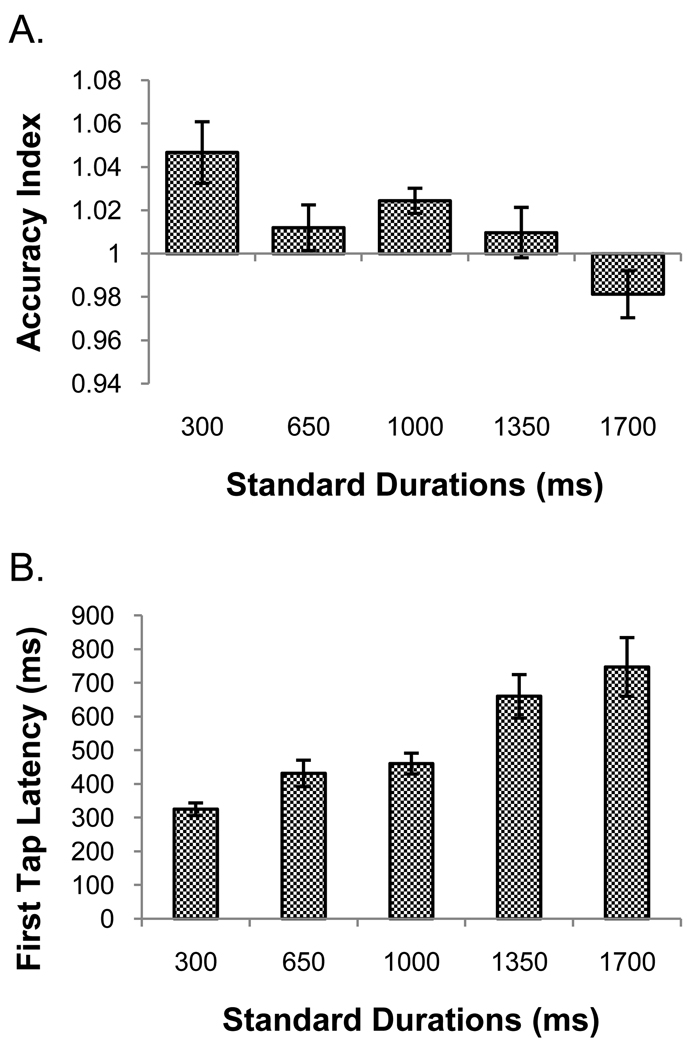
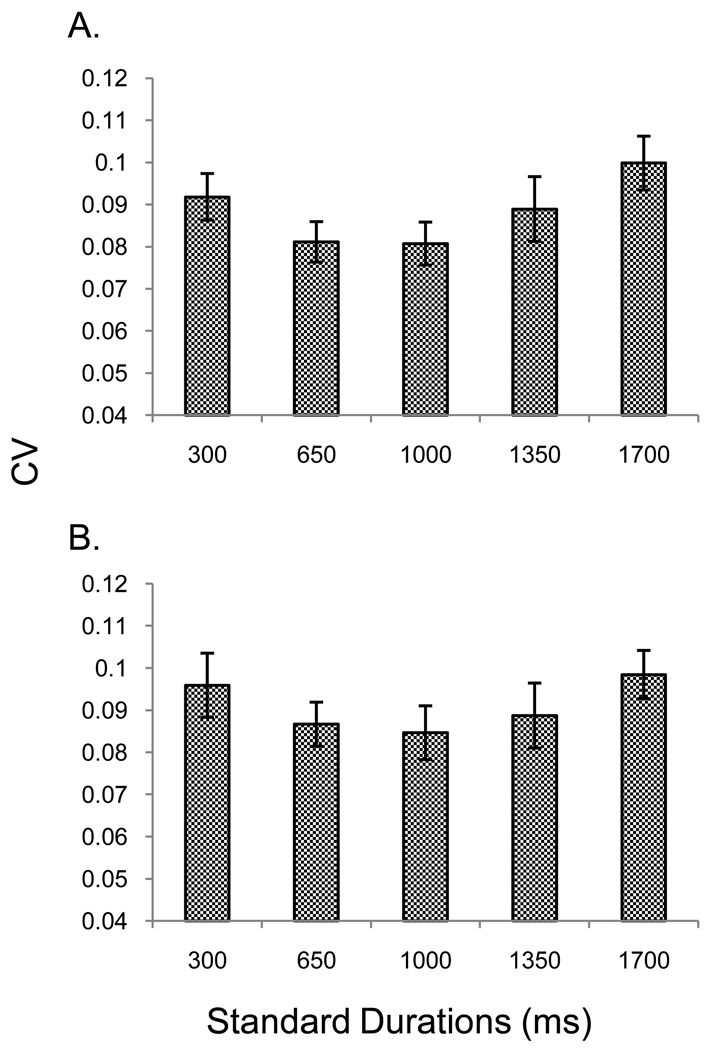
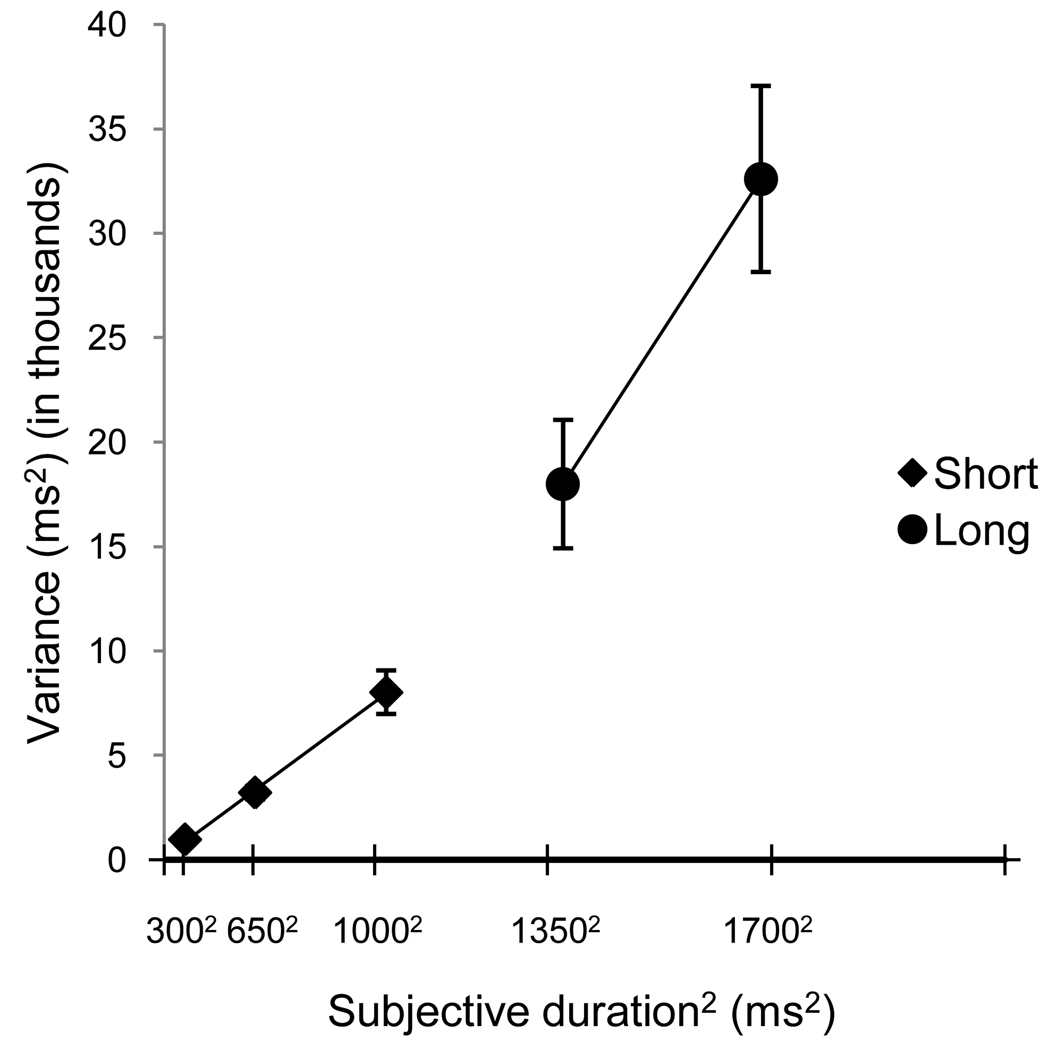
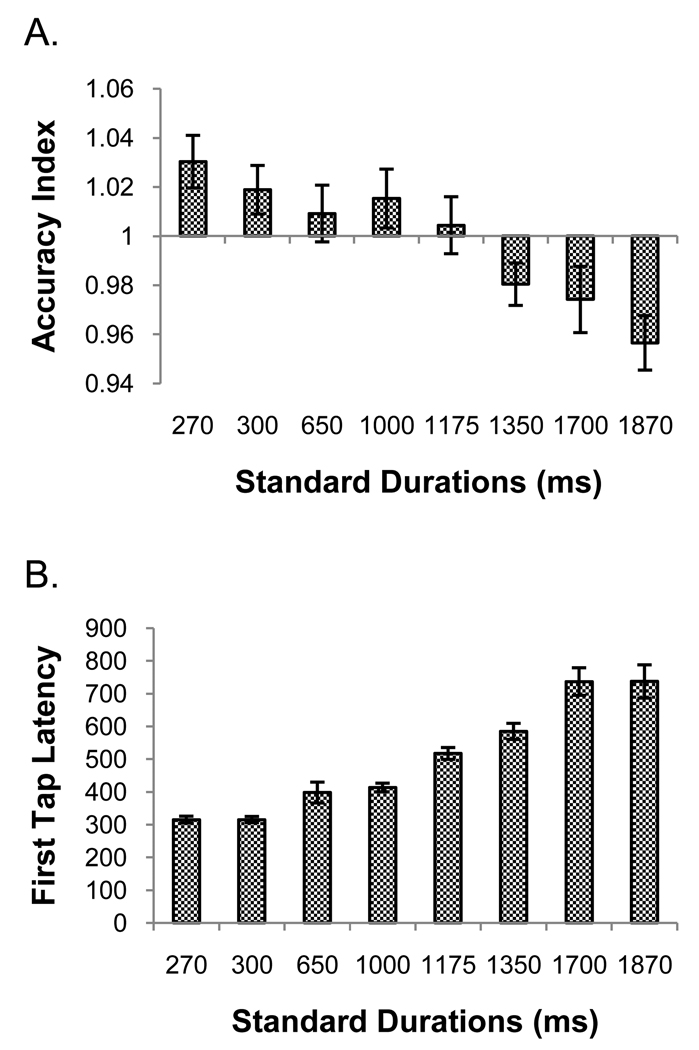
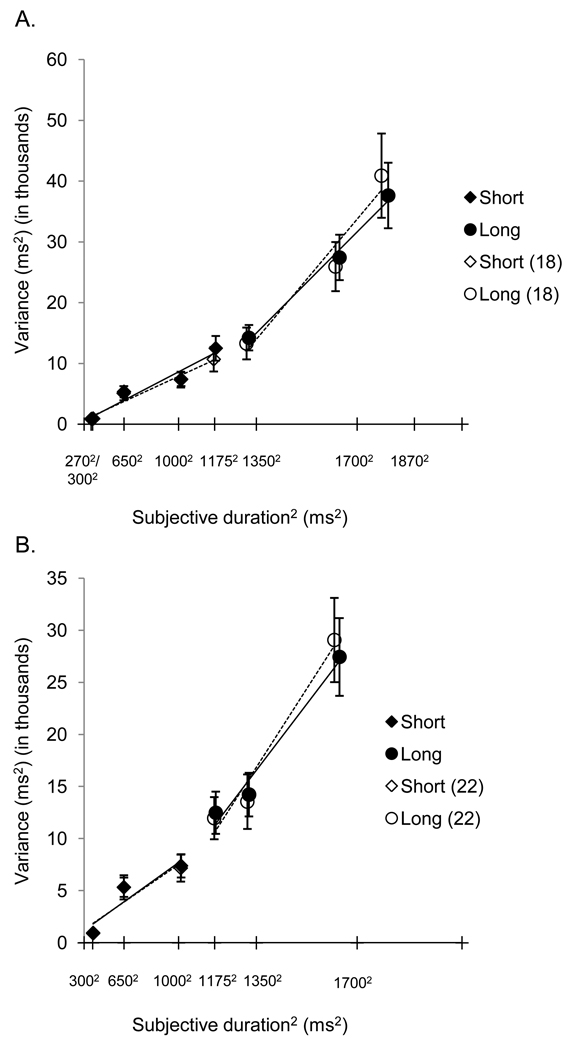
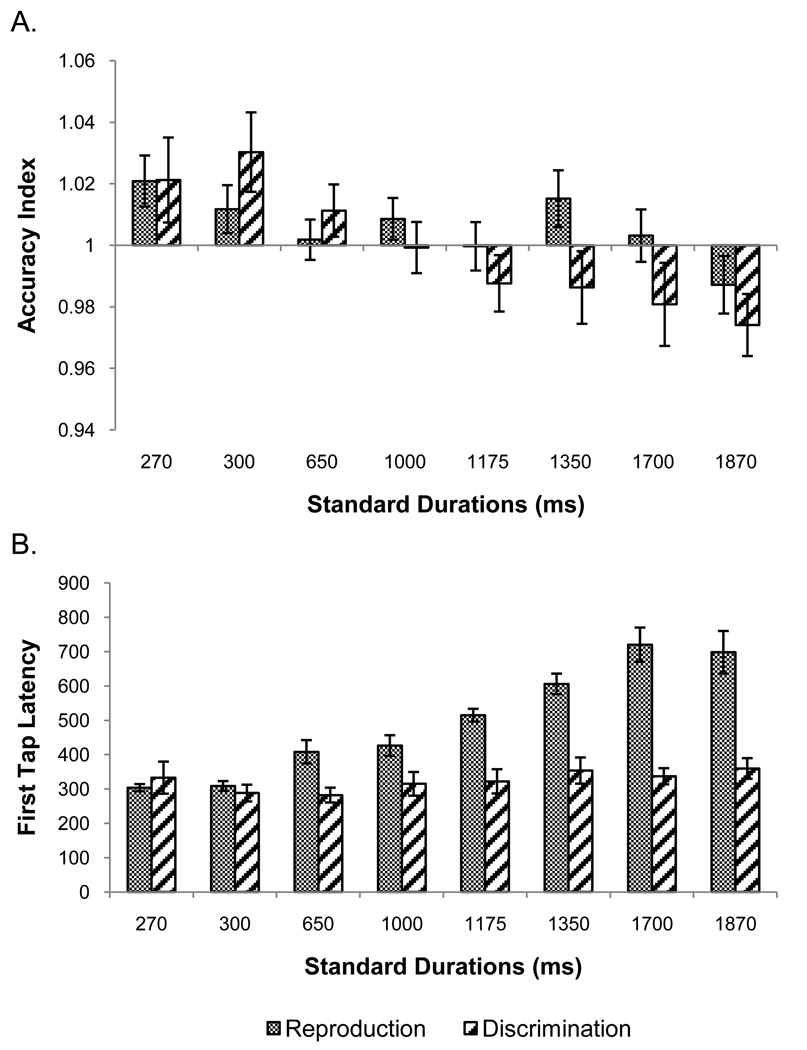
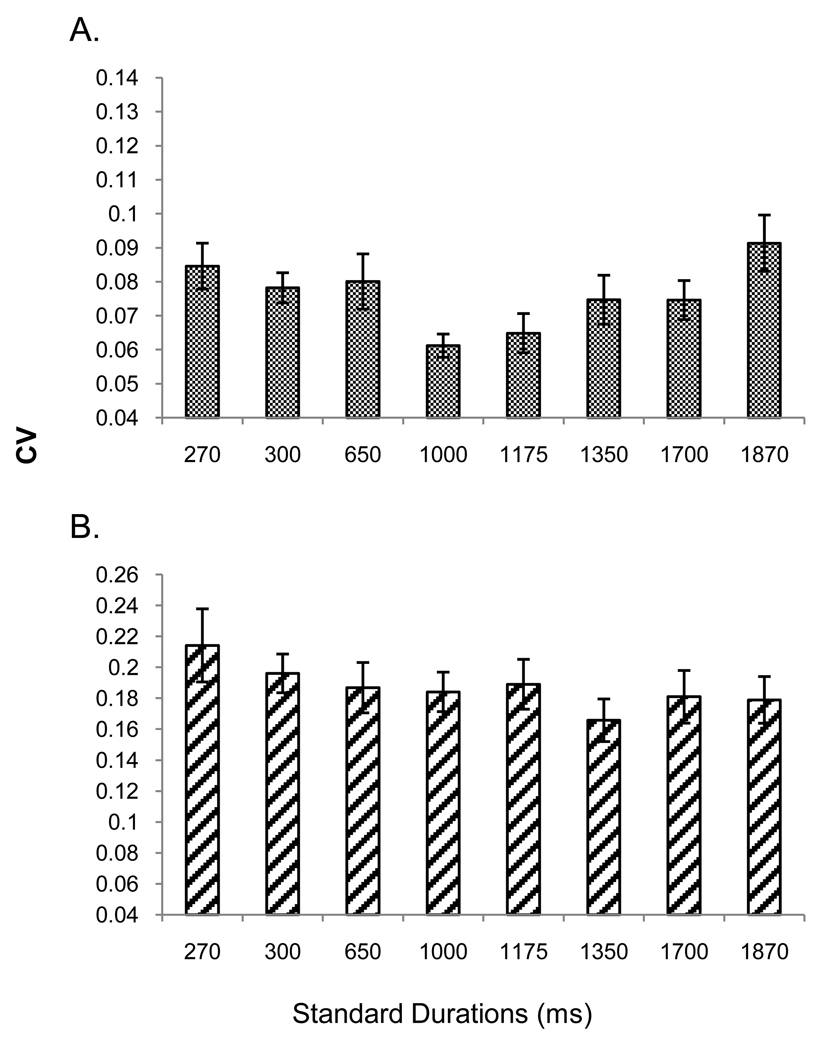
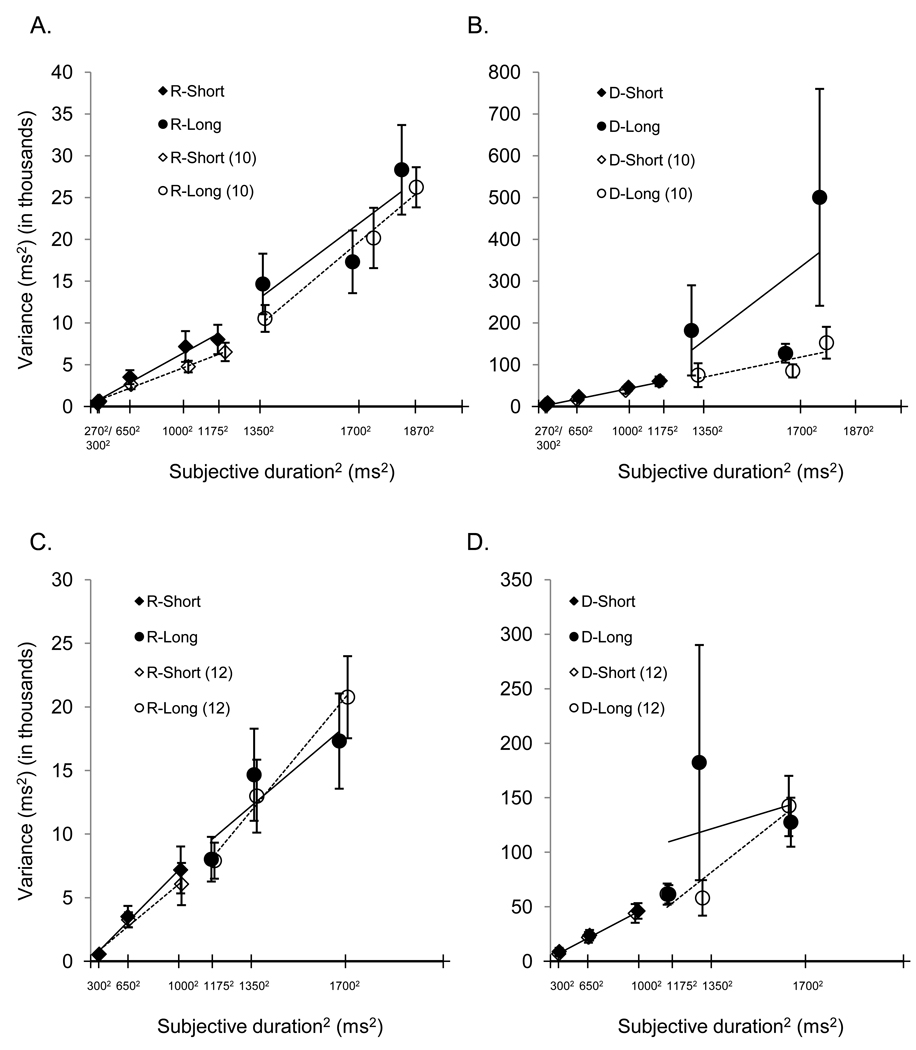
Currently, it is unclear what model of timing best describes temporal processing across millisecond and second timescales in tasks with different response requirements. In the present set of experiments, we assessed whether the popular dedicated scalar model of timing accounts for performance across a restricted timescale surrounding the 1-second duration for different tasks. The first two experiments evaluate whether temporal variability scales proportionally with the timed duration within temporal reproduction. The third experiment compares timing across millisecond and second timescales using temporal reproduction and discrimination tasks designed with parallel structures. The data exhibit violations of the assumptions of a single scalar timekeeper across millisecond and second timescales within temporal reproduction; these violations are less apparent for temporal discrimination. The finding of differences across tasks suggests that task demands influence the mechanisms that are engaged for keeping time.


Figures

Figure 1
Figure 1
Trial schematic for A) temporal reproduction and B) temporal discrimination. STAND = Standard Duration, CD = Comparison Duration. Note that the grey fixation cross was green when presented to participants.
Figure 2
Figure 2
Feedback screens for the reproduction (Panels A and B) and discrimination (Panels C and D) tasks. In both panels A and B, the black bar represents the reference, or standard duration and the grey bar indicates the length of the participant’s reproduced duration. The vertical line is the cutoff between a reproduction that is too short or too long. Panel A shows a reproduction that was too short. Panel B shows one that was too long. Panel C shows the type of feedback given at the end of a single practice trial during the discrimination task. The black bar represents the standard duration and the grey bar represents the length of the comparison duration that was just presented on the trial. The vertical line is the cutoff between a value that is shorter than the standard and one that is longer. This example shows feedback after a longer comparison was presented. Panel D shows the type of feedback given at the end of each test run for discrimination. Feedback about the overall percentage of correct classifications of each comparison duration type (short or long) over the run are shown in the feedback. The closer the grey bars are to 100%, the better the classification of comparison durations in relation to the standard. Note that the grey bars in all of the feedback screens were actually red when presented to participants.
Figure 3
Figure 3
Panel A shows the accuracy index data from temporal reproduction in experiment 1. The abscissa crosses the ordinate at the point which represents perfect accuracy. Values greater than 1 indicate over-reproductions, while values less than 1 indicate under-reproductions. Panel B shows the latency to first tap data for reproduction from experiment 1. Error bars are mean ± 1 standard error.
Figure 4
Figure 4
Panel A shows the CV data from the reproduction task of experiment 1 collapsed across all participants and runs. Panel B shows the CV data for the first set of blocks only. Error bars represent the mean ± 1 standard error.
Figure 5
Figure 5
The bi-linear Weber plots from experiment 1's temporal reproduction task fit to the averaged data across participants using the mean breakpoint. Error bars are ±1 standard error.
Figure 6
Figure 6
Panel A shows the accuracy index data from the reproduction task of experiment 2. The abscissa crosses the ordinate at the point which represents perfect accuracy. Values greater than 1 indicate over-reproductions, while values less than 1 indicate under-reproductions. Panel B shows the latency to first tap data for reproduction from experiment 2. Error bars are mean ± 1 standard error.
Figure 7
Figure 7
CV data from the reproduction task of experiment 2. Error bars represent the mean ± 1 standard error.
Figure 8
Figure 8
Panel A shows the average Weber function and bilinear fits calculated across all participants and across only the 18 individuals with positive slopes using the average breakpoint across all participants for experiment 2's reproduction task. Panel B shows the average Weber function and bilinear fits for the truncated data from all participants and only the 22 individuals with positive slopes using the average breakpoint. In both panels, solid lines indicate the data for all participants, while dashed lines indicate data for only the individuals with positive Weber slopes. Error bars are represent the mean ±1 standard error.
Figure 9
Figure 9
Panel A shows the accuracy index data from the reproduction and discrimination tasks of experiment 3. The abscissa crosses the ordinate at the point which represents perfect accuracy. Values greater than 1 indicate over-reproductions, while values less than 1 indicate under-reproductions. Panel B shows the latency to first tap data for the two tasks from experiment 3. Error bars are mean ± 1 standard error.
Figure 10
Figure 10
CV data from experiment 3 for A) reproduction and B) discrimination. Error bars represent the mean ± 1 standard error.
Figure 11
Figure 11
Panel A shows the average Weber function and bilinear fits calculated for the reproduction task across all participants and across only the 10 individuals with positive slopes using the average breakpoint across all participants. Panel B shows these same data from the discrimination task. Panel C shows the average Weber function and bilinear fits for the reproduction task truncated data from all participants and only the 12 individuals with positive slopes using the average breakpoint. Panel D shows the same data for the discrimination task. In all four panels, solid lines indicate the data for all participants, while dashed lines indicate data for only the individuals with positive Weber slopes. Error bars are ±1 standard error.

References

    1. Allan LG. The influence of the scalar timing model on human timing research. Behavioural Processes. 1998;44:101–117. - PubMed
    1. Baudouin A, Vanneste S, Pouthas V, Isingrini M. Age-related changes in duration reproduction: Involvement of working memory processes. Brain and Cognition. 2006;62(1):17–23. - PubMed
    1. Bizo LA, Chu JYM, Sanabria F, Killeen PR. The failure of Weber's law in time perception and production. Behavioural Processes. 2006;71(2):201–210. - PubMed
    1. Brown SW. Attentional resources in timing: Interference effects in concurrent temporal and nontemporal working memory tasks. Perception & Psychophysics. 1997;59(7):1118–1140. - PubMed
    1. Buhusi CV, Meck WH. What makes us tick? Functional and neural mechanisms of interval timing. Nature Reviews Neuroscience. 2005;6(10):755–765. - PubMed

Publication types

LinkOut - more resources