

The peritoneal cavity B-2 antibody repertoire appears to reflect many of the same selective pressures that shape the B-1a and B-1b repertoires
- PMID: 20956345
- PMCID: PMC3667605
- DOI: 10.4049/jimmunol.1001423
The peritoneal cavity B-2 antibody repertoire appears to reflect many of the same selective pressures that shape the B-1a and B-1b repertoires
Abstract
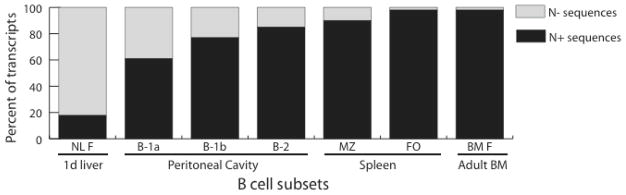
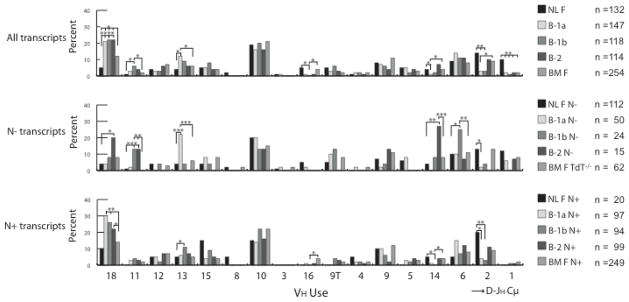
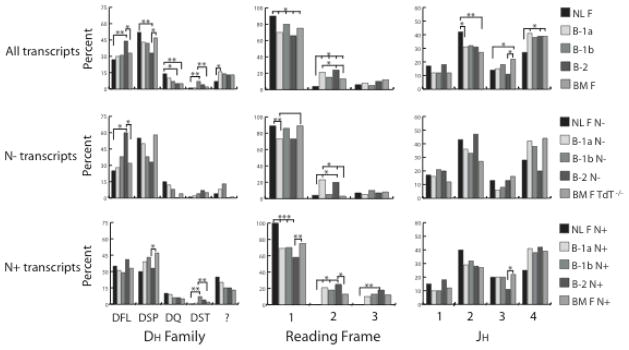
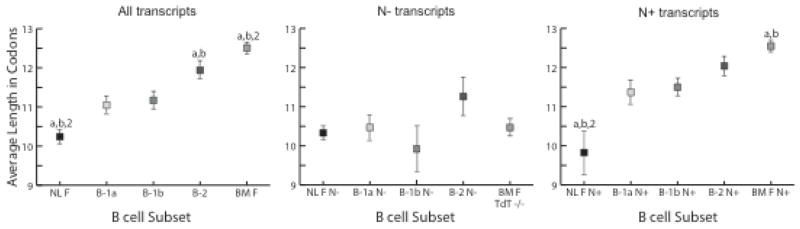
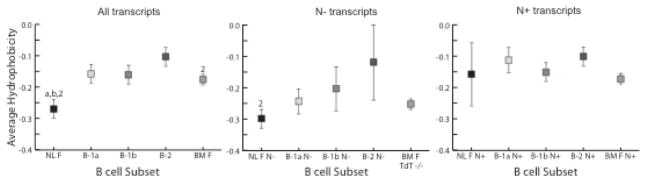
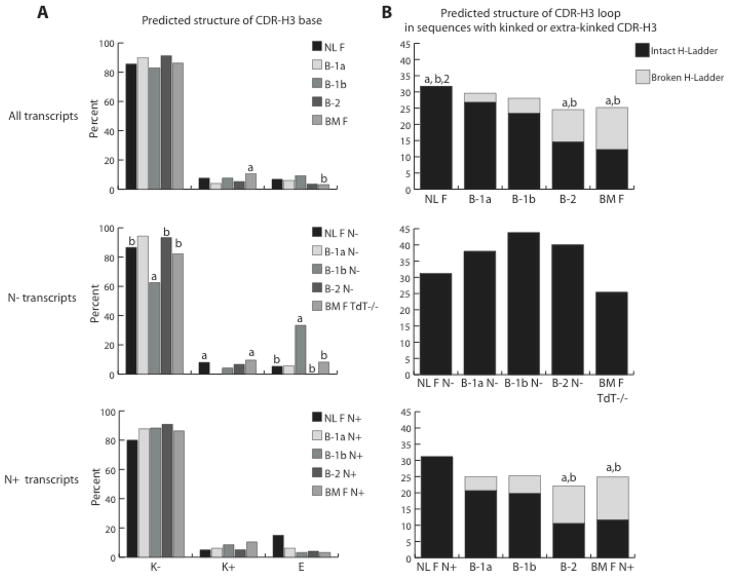
To assess the extent and nature of somatic categorical selection of CDR-3 of the Ig H chain (CDR-H3) content in peritoneal cavity (PerC) B cells, we analyzed the composition of V(H)7183DJCμ transcripts derived from sorted PerC B-1a, B-1b, and B-2 cells. We divided these sequences into those that contained N nucleotides (N(+)) and those that did not (N(-)) and then compared them with sequences cloned from sorted IgM(+)IgD(+) B cells from neonatal liver and both wild-type and TdT-deficient adult bone marrow. We found that the PerC B-1a N(-) repertoire is enriched for the signatures of CDR-H3 sequences present in neonatal liver and shares many features with the B-1b N(-) repertoire, whereas the PerC B-1a N(+), B-1b N(+), and B-2 N(+) repertoires are enriched for adult bone marrow sequence signatures. However, we also found several sequence signatures that were not shared with other mature perinatal or adult B cell subsets but were either unique or variably shared between the two or even among all three of the PerC subsets that we examined. These signatures included more sequences lacking N nucleotides in the B-2 population and an increased use of D(H) reading frame 2, which created CDR-H3s of greater average hydrophobicity. These findings provide support for both ontogenetic origin and shared Ag receptor-influenced selection as the mechanisms that shape the unique composition of the B-1a, B-1b, and B-2 repertoires. The PerC may thus serve as a general reservoir for B cells with Ag binding specificities that are uncommon in other mature compartments.
Figures


 ) NL F: features shared with neonatal liver fraction F; (
 ) BM F: features shared with adult bone marrow from WT; (
 ) TdT: features shared with adult bone marrow from TdT deficient mice; (
 ) B-1a: unique features of B-1a cells; (
 ) B-1b: unique features of B-1b cells; (
 ) B-2: unique features of B-2 cells. (Bold black) features shared between two or all three PerC B cell subsets.
References
-
- Kabat EA, Wu TT, Perry HM, Gottesman KS, Foeller C. Sequences of proteins of immunological interest. U.S. Department of Health and Human Services; Bethesda, Maryland: 1991.
-
- Xu JL, Davis MM. Diversity in the CDR3 region of V(H) is sufficient for most antibody specificities. Immunity. 2000;13:37–45. - PubMed
-
- Lafaille JJ, DeCloux A, Bonneville M, Takagaki Y, Tonegawa S. Junctional sequences of T cell receptor gamma delta genes: implications for gamma delta T cell lineages and for a novel intermediate of V-(D)-J joining. Cell. 1989;59:859–870. - PubMed
-
- Tonegawa S. Somatic generation of antibody diversity. Nature. 1983;302:575–581. - PubMed
Publication types
MeSH terms
Substances
Associated data
- Actions
- Actions
- Actions
- Actions
- Actions
- Actions
- Actions
- Actions
- Actions
- Actions
- Actions
- Actions
- Actions
- Actions
- Actions
- Actions
- Actions
- Actions
- Actions
- Actions
- Actions
- Actions
- Actions
- Actions
- Actions
- Actions
- Actions
- Actions
- Actions
- Actions
- Actions
- Actions
- Actions
- Actions
- Actions
- Actions
- Actions
- Actions
- Actions
- Actions
- Actions
- Actions
- Actions
- Actions
- Actions
- Actions
- Actions
- Actions
- Actions
- Actions
- Actions
- Actions
- Actions
- Actions
- Actions
- Actions
- Actions
- Actions
- Actions
- Actions
- Actions
- Actions
- Actions
- Actions
- Actions
- Actions
- Actions
- Actions
- Actions
- Actions
- Actions
- Actions
- Actions
- Actions
- Actions
- Actions
- Actions
- Actions
- Actions
- Actions
- Actions
- Actions
- Actions
- Actions
- Actions
- Actions
- Actions
- Actions
- Actions
- Actions
- Actions
- Actions
- Actions
- Actions
- Actions
- Actions
- Actions
- Actions
- Actions
- Actions
- Actions
- Actions
- Actions
- Actions
- Actions
- Actions
- Actions
- Actions
- Actions
- Actions
- Actions
- Actions
- Actions
- Actions
- Actions
- Actions
- Actions
- Actions
- Actions
- Actions
- Actions
- Actions
- Actions
- Actions
- Actions
- Actions
- Actions
- Actions
- Actions
- Actions
- Actions
- Actions
- Actions
- Actions
- Actions
- Actions
- Actions
- Actions
- Actions
- Actions
- Actions
- Actions
- Actions
- Actions
- Actions
- Actions
- Actions
- Actions
- Actions
- Actions
- Actions
- Actions
- Actions
- Actions
- Actions
- Actions
- Actions
- Actions
- Actions
- Actions
- Actions
- Actions
- Actions
- Actions
- Actions
- Actions
- Actions
- Actions
- Actions
- Actions
- Actions
- Actions
- Actions
- Actions
- Actions
- Actions
- Actions
- Actions
- Actions
- Actions
- Actions
- Actions
- Actions
- Actions
- Actions
- Actions
- Actions
- Actions
- Actions
- Actions
- Actions
- Actions
- Actions
- Actions
- Actions
- Actions
- Actions
- Actions
- Actions
- Actions
- Actions
- Actions
- Actions
- Actions
- Actions
- Actions
- Actions
- Actions
- Actions
- Actions
- Actions
- Actions
- Actions
- Actions
- Actions
- Actions
- Actions
- Actions
- Actions
- Actions
- Actions
- Actions
- Actions
- Actions
- Actions
- Actions
- Actions
- Actions
- Actions
- Actions
- Actions
- Actions
- Actions
- Actions
- Actions
- Actions
- Actions
- Actions
- Actions
- Actions
- Actions
- Actions
- Actions
- Actions
- Actions
- Actions
- Actions
- Actions
- Actions
- Actions
- Actions
- Actions
- Actions
- Actions
- Actions
- Actions
- Actions
- Actions
- Actions
- Actions
- Actions
- Actions
- Actions
- Actions
- Actions
- Actions
- Actions
- Actions
- Actions
- Actions
- Actions
- Actions
- Actions
- Actions
- Actions
- Actions
- Actions
- Actions
- Actions
- Actions
- Actions
- Actions
- Actions
- Actions
- Actions
- Actions
- Actions
- Actions
- Actions
- Actions
- Actions
- Actions
- Actions
- Actions
- Actions
- Actions
- Actions
- Actions
- Actions
- Actions
- Actions
- Actions
- Actions
- Actions
- Actions
- Actions
- Actions
- Actions
- Actions
- Actions
- Actions
- Actions
- Actions
- Actions
- Actions
- Actions
- Actions
- Actions
- Actions
- Actions
- Actions
- Actions
- Actions
- Actions
- Actions
- Actions
- Actions
- Actions
- Actions
- Actions
- Actions
- Actions
- Actions
- Actions
- Actions
- Actions
- Actions
- Actions
- Actions
- Actions
- Actions
- Actions
- Actions
- Actions
- Actions
- Actions
- Actions
- Actions
- Actions
- Actions
- Actions
- Actions
- Actions
- Actions
- Actions
- Actions
- Actions
- Actions
- Actions
- Actions
- Actions
- Actions
- Actions
- Actions
- Actions
- Actions
- Actions
- Actions
- Actions
- Actions
- Actions
- Actions
- Actions
- Actions
- Actions
Grants and funding
LinkOut - more resources
Full Text Sources
