. 2010 Oct 18;191(2):303-12.
doi: 10.1083/jcb.201004003.

Cell shape and contractility regulate ciliogenesis in cell cycle-arrested cells

Affiliations

Cell shape and contractility regulate ciliogenesis in cell cycle-arrested cells

Amandine Pitaval et al. J Cell Biol. .

Abstract

In most lineages, cell cycle exit is correlated with the growth of a primary cilium. We analyzed cell cycle exit and ciliogenesis in human retinal cells and found that, contrary to the classical view, not all cells exiting the cell division cycle generate a primary cilium. Using adhesive micropatterns to control individual cell spreading, we demonstrate that cell spatial confinement is a major regulator of ciliogenesis. When spatially confined, cells assemble a contractile actin network along their ventral surface and a protrusive network along their dorsal surface. The nucleus-centrosome axis in confined cells is oriented toward the dorsal surface where the primary cilium is formed. In contrast, highly spread cells assemble mostly contractile actin bundles. The nucleus-centrosome axis of spread cells is oriented toward the ventral surface, where contractility prevented primary cilium growth. These results indicate that cell geometrical confinement affects cell polarity via the modulation of actin network architecture and thereby regulates basal body positioning and primary cilium growth.


Figures
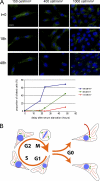
Figure 1.
Figure 1.
Growth arrest, confluency, and ciliogenesis. (A) RPE1 cells were plated on polystyrene-coated glass coverslips at various densities and serum starved. At different time points, cells were fixed and labeled for acetylated tubulin (green) to reveal primary cilia and DNA (blue). The graph shows the quantification of the proportion of ciliated cells in these conditions (the number of quantified cells is given for every time point: 150 cells/mm2, n = 20, 50, 58, and 34; 400 cells/mm2, n = 118, 183, 101, and 171; and 1,000 cells/mm2, n = 174, 312, 108, and 166). Bar, 10 µm. (B) Working model: cells can adopt two distinct states in G0 with or without growing a primary cilium.
Figure 2.
Figure 2.
Cell cycle exit in G1. (A) Cells were plated on large, fibronectin-coated discoidal micropatterns to prevent them from escaping the observation field. They were monitored by time-lapse microscopy to measure cell division time with respect to the time of starvation and to follow the fate of daughter cells. The red cell illustrates starvation in early G1: the cell divided 2.5 h before starvation and stopped dividing after. The blue cell illustrates starvation in late G1: the cell divided 5 h before starvation and divided again after. See corresponding Video 1 and Fig. S1. Bar, 100 µm. (B) The histogram shows the proportion of dividing and nondividing cells, depending on the cell cycle stage when starvation occurred (S, n = 31; G2, n = 31; early G1 [<2 h after mitosis], n = 92; and late G1 [>5 h after mitosis], n = 130). (C) Experimental procedure used for the following experiments. Cells were synchronized in early G1, plated on a micropatterned coverslip with 10 different sizes of discs ranging from 500 to 3,500 µm2, and serum starved. Bar, 50 µm. (D) G1-starved cells on micropatterns were observed in time-lapse phase-contrast microscopy over 40 h. The proportion of dividing cells (blue), nondividing cells (red), and dying cells (black) were quantified in cells plated on the smallest (500 µm2) and largest (3,500 µm2) micropatterns in the presence (n = 116 and 43, respectively) or absence (n = 123 and 115, respectively) of serum. No clear difference could be observed between the two cell sizes. Bar, 50 µm. (E) Cell quiescence. Cells were plated on micropatterns with or without serum, fixed, and stained for Ki67 (proliferation marker), F-actin (green), and DNA (blue). A large majority of individual cells on small and large micropatterns were quiescent after 24 h of serum starvation, as revealed by their negative Ki67 staining (75%, n = 102; and 79%, n = 174; respectively). Cells proliferated in the presence of serum and were mostly Ki67 positive. Bar, 10 µm.
Figure 3.
Figure 3.
Cell confinement and ciliogenesis. The experimental procedure for all panels is described in Fig. 2 C. (A) Cells on various micropattern sizes were serum starved for 48 h, fixed, and stained for F-actin (top) and acetylated tubulin (bottom with an inset magnification) to reveal the primary cilium. Two examples of cells on 500, 1,500, and 3,500 µm2 are shown to illustrate that most cells on 500 µm2 had a primary cilium, half had one on 1,500 µm2, and most cells on 3, 500 µm2 had no primary cilium. Bars, 20 µm. Inset bar, 4 µm. (B) The proportion of individual ciliated cells on 10 different micropattern sizes (n > 100 for each) is shown with the black curve. The proportion of ciliated cells in cell doublets (two cells per pattern) on 10 different micropattern sizes (n > 100 for each) is shown with the gray curve with respect to individual cell size. (C) Quantification of primary cilium length depending on micropattern size. Primary cilium length was shorter in larger micropatterned cells. (D) Quantification of ciliated cell frequency in cells plated on small (750 µm2) and large (3,000 µm2) micropatterns over time (n > 170 for each). The rate slightly increased from 24 to 48 h and then reached a plateau. (E) Quantification of primary cilium length on small (750 µm2) and large (3,000 µm2) micropatterns 72 h after serum starvation. Primary cilium length was similar to the one measured 24 h after serum starvation (compare with C). *, P < 0.05 and ***, P < 0.001. Plotted bars represent standard deviations. Horizontal bars represent mean values.
Figure 4.
Figure 4.
Actin network assembly, contractility, and ciliogenesis. The experimental procedure for A and B is described in Fig. 2 C. RPE1 cells were plated on micropatterns (from 750 to 3,000 µm2) and serum starved for 24 h. (A) Micropatterned cells were treated with cytochalasin D during starvation. Cells were fixed and stained for acetylated tubulin (red), F-actin (green), and DNA (blue). Primary cilium occurrence (top, n = 82, 97, 82, and 41) and length (bottom, n = 30, 26, 27, and 25) were measured in cells whose shape still covered the entire micropattern after the treatment. Bar, 5 µm. (B) Micropatterned cells were treated with either Y27632 or blebbistatin during starvation. Cells were then fixed and immunolabeled for phosphoezrin (top) and phosphomyosin II (bottom). Z acquisitions were performed and projected on a single image containing the maximal intensity of each pixel. Several images on each micropattern were averaged and color coded with the fire look-up table to highlight intensity variations. Bar, 5 µm. Primary cilium occurrence was measured in each condition (n > 400 for each). (C) RPE1 cells in early G1 were plated at low density on hard substrate (polystyrene-coated glass coverslips) or soft substrate (polyacrylamide gel grafted on glass coverslips). Cells were then serum starved for 48 h, fixed, and stained for F-actin (red), DNA (blue), and acetylated tubulin (green). Most cells on hard substrates had no primary cilium (left). A majority of cells on soft substrates were ciliated (right). Primary cilium occurrence was measured at a cell density of 200 cells/mm2 on hard substrates (n = 300) and on soft substrates (n = 1,140). Primary cilium length was shorter on hard substrates than on soft ones. *, P < 0.05; **, P < 0.01; and ***, P < 0.001. Plotted bars represent standard deviations. Horizontal bars represent mean values. Bar, 20 µm.
Figure 5.
Figure 5.
Cell shape regulates cell polarity and ciliogenesis. The experimental procedure is described in Fig. 2 C. RPE1 cells were plated on small (750 µm2) and large (3,000 µm2) micropatterns and serum starved for 24 h. (A) Micropatterned cells were fixed and immunolabeled to reveal primary cilium, centrosome/basal body, actin filaments, and nucleus (Fig. S3 A). Z stacks were performed to measure centrosome position. The ratio between centrosome position and local cell height was measured in confined and extended cells before and 24 h after serum starvation in ciliated and nonciliated cells. (B) Micropatterned cells were fixed in cold methanol and immunolabeled for γ-tubulin to reveal the centrosome (green) and immunolabeled with α-tubulin to reveal microtubules (red). DNA is in blue. Z stacks were acquired and deconvolved to detect centrosome positioning (Fig. S3 B). XZ optical sections illustrate centrosome positioning above the nucleus in confined cells (left) and below the nucleus in spread cells (right). (C) Micropatterned cells were fixed with paraformaldehyde, immunolabeled for acetylated tubulin (green), and stained with phalloidin (red; Fig. S3 C). DNA is in blue. XZ optical sections illustrate the presence of the primary cilium at the dorsal surface of confined cells (left) and the presence of acetylated microtubules in the cytoplasm of spread cells (right). (D) Results summary. When cells are spatially confined, they develop a polarized actin architecture with contractile bundles in the ventral surface and a polymerizing network in membrane protrusions at the dorsal surface. In these cells, the nucleus–centrosome axis is reproducibly oriented toward the dorsal surface in a Rho kinase–dependent manner. The apical positioning of the centrosome and its anchoring in the ezrin-rich actin network promote the formation of the primary cilium. When cells are highly extended, the actin network is unbalanced toward the formation of numerous and large contractile bundles. The internal polarity is reversed compared with confined cells. The nucleus–centrosome axis is oriented toward the ventral surface in an actin- and microtubule-dependent manner. The centrosome is in close proximity to actin stress fibers, whose contractility prevents the extension of the primary cilium. X bars, 5 µm. Z bars, 2 µm.

Comment in

References

    1. Alieva I.B., Vorobjev I.A. 2004. Vertebrate primary cilia: a sensory part of centrosomal complex in tissue cells, but a “sleeping beauty” in cultured cells? Cell Biol. Int. 28:139–150 10.1016/j.cellbi.2003.11.013 - DOI - PubMed
    1. Alieva I.B., Gorgidze L.A., Komarova Y.A., Chernobelskaya O.A., Vorobjev I.A. 1999. Experimental model for studying the primary cilia in tissue culture cells. Membr. Cell Biol. 12:895–905 - PubMed
    1. Anderson C.T., Stearns T. 2009. Centriole age underlies asynchronous primary cilium growth in mammalian cells. Curr. Biol. 19:1498–1502 10.1016/j.cub.2009.07.034 - DOI - PMC - PubMed
    1. Chen C.S., Mrksich M., Huang S., Whitesides G.M., Ingber D.E. 1997. Geometric control of cell life and death. Science. 276:1425–1428 10.1126/science.276.5317.1425 - DOI - PubMed
    1. Chevrier V., Piel M., Collomb N., Saoudi Y., Frank R., Paintrand M., Narumiya S., Bornens M., Job D. 2002. The Rho-associated protein kinase p160ROCK is required for centrosome positioning. J. Cell Biol. 157:807–817 10.1083/jcb.200203034 - DOI - PMC - PubMed

Publication types