. 2010 Oct 18;191(2):383-95.
doi: 10.1083/jcb.201003042.

Ankyrin G restricts ion channel diffusion at the axonal initial segment before the establishment of the diffusion barrier

Affiliations

Ankyrin G restricts ion channel diffusion at the axonal initial segment before the establishment of the diffusion barrier

Anna Brachet et al. J Cell Biol. .

Abstract

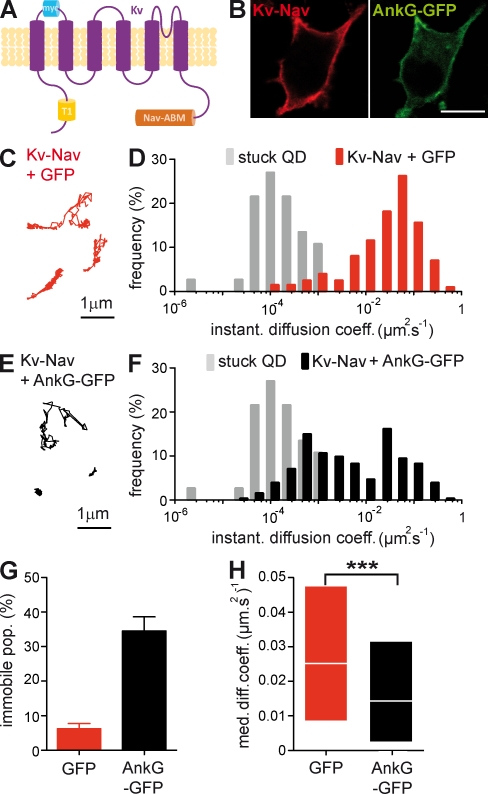
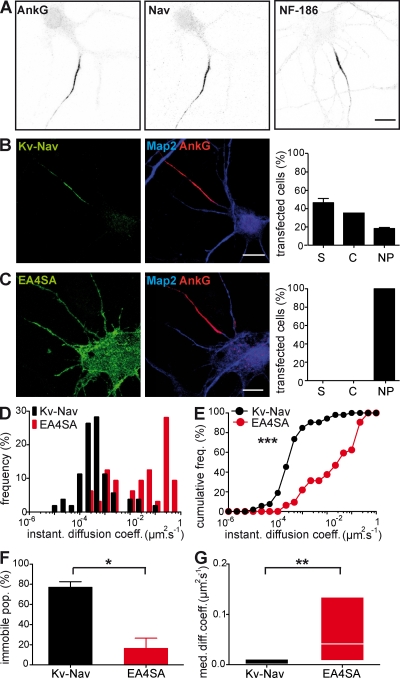
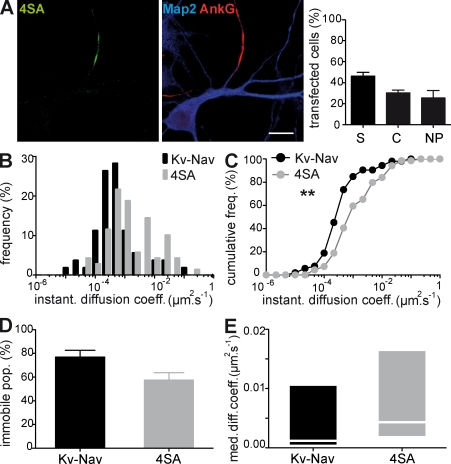
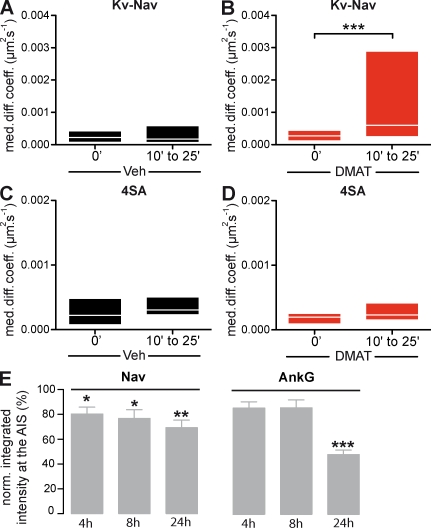
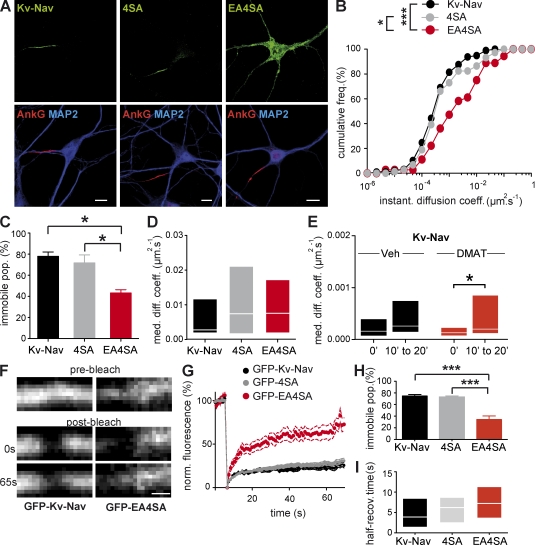
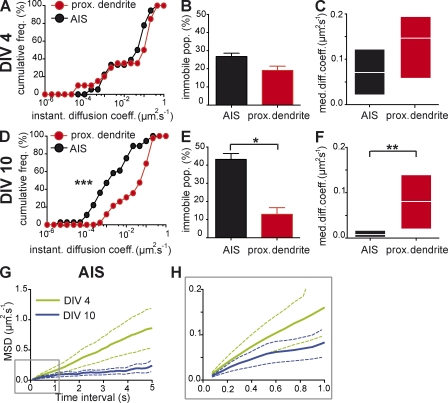
In mammalian neurons, the precise accumulation of sodium channels at the axonal initial segment (AIS) ensures action potential initiation. This accumulation precedes the immobilization of membrane proteins and lipids by a diffusion barrier at the AIS. Using single-particle tracking, we measured the mobility of a chimeric ion channel bearing the ankyrin-binding motif of the Nav1.2 sodium channel. We found that ankyrin G (ankG) limits membrane diffusion of ion channels when coexpressed in neuroblastoma cells. Site-directed mutants with decreased affinity for ankG exhibit increased diffusion speeds. In immature hippocampal neurons, we demonstrated that ion channel immobilization by ankG is regulated by protein kinase CK2 and occurs as soon as ankG accumulates at the AIS of elongating axons. Once the diffusion barrier is formed, ankG is still required to stabilize ion channels. In conclusion, our findings indicate that specific binding to ankG constitutes the initial step for Nav channel immobilization at the AIS membrane and precedes the establishment of the diffusion barrier.


Figures

Figure 1.
Figure 1.
ankG restricts Kv-Nav diffusion at the surface of N2A cells. (A) Schematic representation of Kv-Nav chimera in which the C terminus of Kv2.1 was substituted by a segment encompassing the ankyrin-binding motif of Nav1.2. Note the presence of the tetramerization domain T1 in the N terminus of Kv2.1 and of an extracellular myc tag. (B) Surface expression of Kv-Nav in ankG-GFP–positive cells. Surface Kv-Nav was immunodetected with an antibody to myc (red), and ankG signal corresponds to the GFP fluorescent signal on fixed cells (green). Bar, 10 µm. (C and E) Representative examples of QD trajectories corresponding to Kv-Nav in GFP (red, C)- and ankG-GFP–expressing N2A cells (black, E). (D and F) DIDC of Kv-Nav in GFP (red, D)- and ankG-GFP–expressing N2A cells (black, F). The immobile population (D ≤ 0.00075 µm2.s−1) was defined from the DIDC of QDs stuck on the glass coverslips (gray). Trajectories for GFP (n = 198) and ankG-GFP (n = 253) conditions were analyzed from three and four independent experiments, respectively. (G) Histogram of the mean values ± SEM for the immobile population (percentage) of Kv-Nav in GFP and ankG-GFP conditions. (H) MDC (25–75% IQR) for the mobile population of Kv-Nav in GFP and ankG-GFP conditions. MW: ***, P < 0.001.
Figure 2.
Figure 2.
Relationship between the binding capacities of site-directed Kv-Nav mutants with their restriction of diffusion in N2A cells. (A) Sequence alignment of the ankyrin-binding domain for Kv-Nav, Kv-Nav 4SA (4SA), and Kv-Nav E4SA (E4SA) constructs. Critical residues for the interaction with ankG are represented in bold, and the mutated residues are highlighted in pink. (B–F) SPT of QD-labeled Kv-Nav with various ankyrin-binding affinities. (B and C) DIDC for EA4SA (red, B) and 4SA (gray, C). DIDC for Kv-Nav is represented in black for comparison. Trajectories for E4SA (n = 623) and 4SA (n = 419) conditions were analyzed from six and four independent experiments, respectively. (D and E) Cumulative frequencies of the instantaneous diffusion coefficients for Kv-Nav and 4SA (D) and Kv-Nav and E4SA (E). KS: ***, P < 0.001. (F) Histogram of the mean values ± SEM for the immobile population percentage of Kv-Nav, 4SA, and E4SA. MW: *, P < 0.05 and **, P < 0.01. (G) MDC (25–75% IQR) for the mobile population of Kv-Nav, 4SA, and E4SA. MW: *, P < 0.05; **, P < 0.01; and ***, P < 0.001.
Figure 3.
Figure 3.
Interaction with ankG restricts Kv-Nav diffusion at the AIS in young neurons. (A) Accumulation of endogenous AIS components. DIV 4 hippocampal neurons were stained for ankG, Nav, and NF-186 (black). Bar, 10 µm. (B and C) Mutation of the ankyrin-binding motif perturbs polarized expression of surface Kv-Nav. Cell surface distribution of Kv-Nav (B) and Kv-Nav EA4SA (E4SA; C). DIV 4 cultured hippocampal neurons were transfected with the different constructs. Kv-Nav constructs were detected with an antibody against myc (green). The somatodendritic domain and the AIS were identified by MAP2 (blue) and ankG staining (red), respectively. Bars, 10 µm. (right) Histograms of the cell surface distribution for Kv-Nav (B) and EA4SA (C). The expression profiles of transfected (myc positive) neurons were classified into three categories: myc staining segregated at the AIS (segregated, S); distributed at the cell surface of the soma and proximal dendrites with a concentration at the AIS (concentrated, C); and uniformly distributed at the cell surface (nonpolarized, NP). 100% represents the total population of transfected neurons. Data are means ± SEM with n = 165 and 52 from four and two independent experiments for Kv-Nav and EA4SA, respectively. (D and E) Distribution (D) and cumulative frequency (E) of the instantaneous diffusion coefficients of Kv-Nav and EA4SA (n = 53 and 32 trajectories from four independent experiments for Kv-Nav and EA4SA, respectively). KS: ***, P < 0.001. (F) Histogram of the mean values ± SEM for the immobile population of Kv-Nav and EA4SA. MW: *, P < 0.05. (G) MDC (25–75% IQR) of the mobile population of Kv-Nav and EA4SA. MW: **, P < 0.01.
Figure 4.
Figure 4.
Involvement of the ankyrin-binding motif serine residues in Kv-Nav immobilization at the AIS in young neurons. (A) Cell surface distribution of Kv-Nav 4SA (4SA), a phosphodeficient mutant, in DIV 4 hippocampal neurons. Quantification of the cell surface distribution of 4SA is represented on the right and was performed as described in Fig. 3. Data are means ± SEM with n = 144 from four different experiments. Bar, 10 µm. (B and C) Distributions (B) and cumulative frequencies (C) of the instantaneous diffusion coefficients of 4SA (n = 69 trajectories from five independent experiments for 4SA. KS: **, P < 0.01). (D) Histogram of the mean values ± SEM for the immobile population of Kv-Nav and Kv-Nav 4SA. (E) MDC (25–75% IQR) of the mobile population of Kv-Nav and Kv-Nav 4SA.
Figure 5.
Figure 5.
Pharmacological inhibition of CK2 releases ion channels from immobility and destabilizes ion channel concentration at the AIS in young neurons. (A–D) SPT on Kv-Nav (A and B) and Kv-Nav 4SA (C and D) in DIV 4 neurons in the presence of the CK2 inhibitor DMAT. QD trajectories were recorded at the AIS of DIV 4 neurons acutely treated with 50 µM DMAT or a vehicle only during the indicated time intervals. For Kv-Nav, trajectories for vehicle (n = 14) and DMAT (n = 19) were analyzed from three and four independent experiments, respectively. For Kv-Nav 4SA, trajectories for vehicle (n = 11) and DMAT (n = 12) were analyzed from three indepent experiments. MDC (25–75% IQR) before and after drug addition for Kv-Nav (A and B) and Kv-Nav 4SA (C and D). WSR: ***, P < 0.001. (E) Effect of DMAT on the accumulation of AIS components in young neurons. DIV 3 cells were treated with either 50 µM DMAT or with DMSO (control cells) for 4, 8, and 24 h and were subsequently immunostained for Nav1 channels and ankG. Quantification of the respective fluorescence intensity was achieved and was normalized to 100%, representing the staining intensity measured in control cells. Histogram represents the normalized mean values ± SEM. The number of quantified AISs range from 69 to 118 per condition (two independent experiments). t test: *, P < 0.05; **, P < 0.01; and ***, P < 0.001.
Figure 6.
Figure 6.
Interaction with ankG restricts Kv-Nav diffusion at the AIS of mature neurons. (A) Surface distribution of Kv-Nav, Kv-Nav 4SA (4SA), and Kv-Nav EA4SA (EA4SA) in DIV 10 hippocampal neurons. Cultured hippocampal neurons were transfected with the indicated constructs. Kv-Nav and mutants were detected, and neurons were stained as explained in Fig. 3. Bars, 10 µm. (B–E) SPT of QD-labeled Kv-Nav and mutants in DIV 10 neurons. (B) Cumulative frequencies of the instantaneous diffusion coefficients of Kv-Nav, 4SA, and EA4SA. Trajectories for Kv-Nav (n = 97), 4SA (n = 75), and EA4SA (n = 36) were analyzed from six, five, and five independent experiments, respectively. KS: *, P < 0.05 and ***, P < 0.001. (C) Histogram of the mean values ± SEM for the immobile population percentage of Kv-Nav, 4SA, and EA4SA. MW: *, P < 0.05. (D) MDC (25–75% IQR) of the mobile population of Kv-Nav, 4SA, and EA4SA. (E) SPT on Kv-Nav at the AIS of DIV 10 neurons acutely treated with 50 µM DMAT or vehicle. MDC (25–75% IQR) before and after drug addition. Analysis was performed as explained in Fig. 5. For DMAT condition, n = 11 trajectories from four independent experiments. For vehicle condition, n = 10 trajectories from three independent experiments. WSR: *, P < 0.05. (F–I) Analysis of the diffusion properties of GFP–Kv-Nav and mutants in DIV 10 neurons by FRAP. n = 22, 27, and 17 bleached regions that were analyzed from three independent experiments for Kv-Nav, EA4SA, and 4SA, respectively. (F) Representative examples of GFP–Kv-Nav (left) and GFP-EA4S4A (right) fluorescence at the AIS before photobleaching, immediately after photobleaching, and 65 s later. Bar, 1 µm. (G) Plot of the normalized mean fluorescence intensity ± SEM for GFP–Kv-Nav and mutants versus time before and after photobleaching. (H) Histogram of the mean values ± SEM for the immobile population percentage of indicated constructs. MW: ***, P < 0.001. (I) Histogram of the median values ± IQR (25–75%) for the half-recovery time constant of indicated constructs.
Figure 7.
Figure 7.
The diffusion barrier is formed in DIV 10 but not in DIV 4 neurons. Comparison of the diffusion behavior of a mutant deficient for ankyrin binding (Kv-Nav EA4SA) at two development stages, DIV 4 (A–C) and DIV 10 (D–F), and in two distinct compartments of the plasma membrane, the AIS and proximal dendrites. For DIV 4, n = 18 and 20 trajectories from three and two independent experiments at the AIS and at proximal dendrites, respectively. For DIV 10, n = 36 and 41 trajectories from three and two independent experiments at the AIS and at proximal dendrites, respectively. (A and D) Cumulative frequencies of the instantaneous diffusion coefficients at the AIS and in proximal dendrites in DIV 4 (A) and DIV 10 (D) neurons. KS: ***, P < 0.001. (B and E) Histogram of the mean values ± SEM of the immobile population percentage in DIV 4 (B) and DIV 10 (E) neurons at the AIS and in proximal dendrites. MW: *, P < 0.05. (C and F) MDC (25–75% IQR) of the mobile population at the AIS and in proximal dendrites. MW: **, P < 0.01. (G) Mean plot of the MSD of the mobile population versus time (solid line) ± SEM (dotted line) for the indicated period for the mobile population at the AIS of DIV 4 and DIV 10 neurons. (H) Magnification of the boxed area in G.

References

    1. Angelides K.J., Elmer L.W., Loftus D., Elson E. 1988. Distribution and lateral mobility of voltage-dependent sodium channels in neurons. J. Cell Biol. 106:1911–1925 10.1083/jcb.106.6.1911 - DOI - PMC - PubMed
    1. Bats C., Groc L., Choquet D. 2007. The interaction between Stargazin and PSD-95 regulates AMPA receptor surface trafficking. Neuron. 53:719–734 10.1016/j.neuron.2007.01.030 - DOI - PubMed
    1. Berghs S., Aggujaro D., Dirkx R., Jr, Maksimova E., Stabach P., Hermel J.M., Zhang J.P., Philbrick W., Slepnev V., Ort T., Solimena M. 2000. βIV spectrin, a new spectrin localized at axon initial segments and nodes of ranvier in the central and peripheral nervous system. J. Cell Biol. 151:985–1002 10.1083/jcb.151.5.985 - DOI - PMC - PubMed
    1. Boiko T., Vakulenko M., Ewers H., Yap C.C., Norden C., Winckler B. 2007. Ankyrin-dependent and -independent mechanisms orchestrate axonal compartmentalization of L1 family members neurofascin and L1/neuron-glia cell adhesion molecule. J. Neurosci. 27:590–603 10.1523/JNEUROSCI.4302-06.2007 - DOI - PMC - PubMed
    1. Borgdorff A.J., Choquet D. 2002. Regulation of AMPA receptor lateral movements. Nature. 417:649–653 10.1038/nature00780 - DOI - PubMed

Publication types