. 2011 Jan;60(1):64-73.
doi: 10.2337/db10-0698. Epub 2010 Oct 18.

Lipid-induced insulin resistance affects women less than men and is not accompanied by inflammation or impaired proximal insulin signaling

Affiliations

Lipid-induced insulin resistance affects women less than men and is not accompanied by inflammation or impaired proximal insulin signaling

Louise D Høeg et al. Diabetes. 2011 Jan.

Abstract

Objective: We have previously shown that overnight fasted women have higher insulin-stimulated whole body and leg glucose uptake despite a higher intramyocellular triacylglycerol concentration than men. Women also express higher muscle mRNA levels of proteins related to lipid metabolism than men. We therefore hypothesized that women would be less prone to lipid-induced insulin resistance.

Research design and methods: Insulin sensitivity of whole-body and leg glucose disposal was studied in 16 young well-matched healthy men and women infused with intralipid or saline for 7 h. Muscle biopsies were obtained before and during a euglycemic-hyperinsulinemic clamp (1.42 mU · kg⁻¹ · min⁻¹).

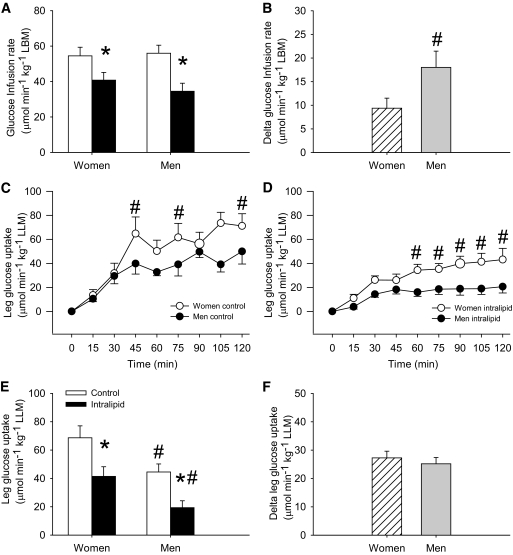
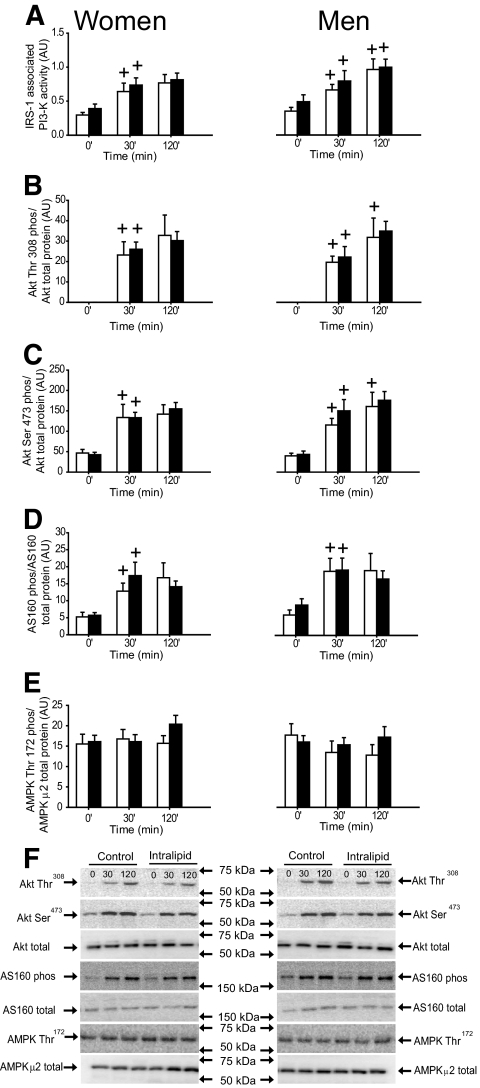
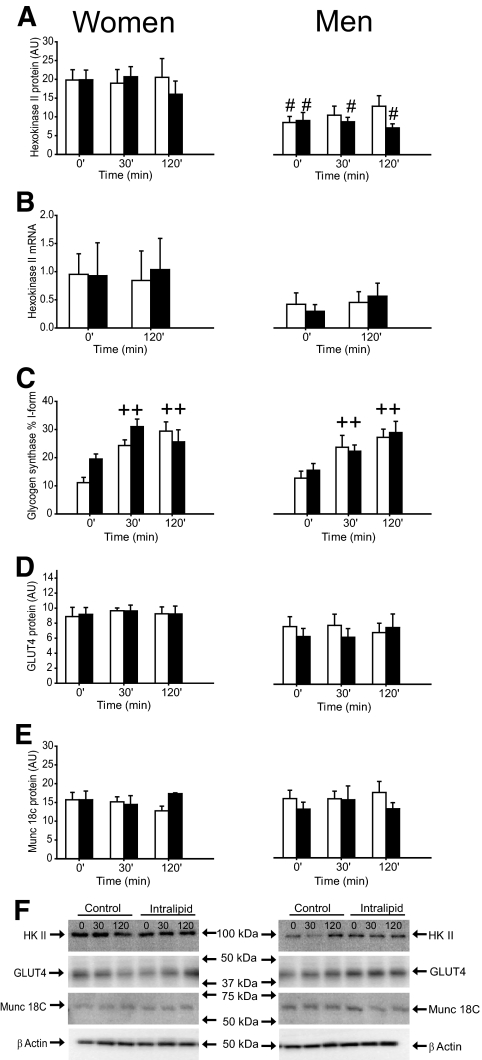
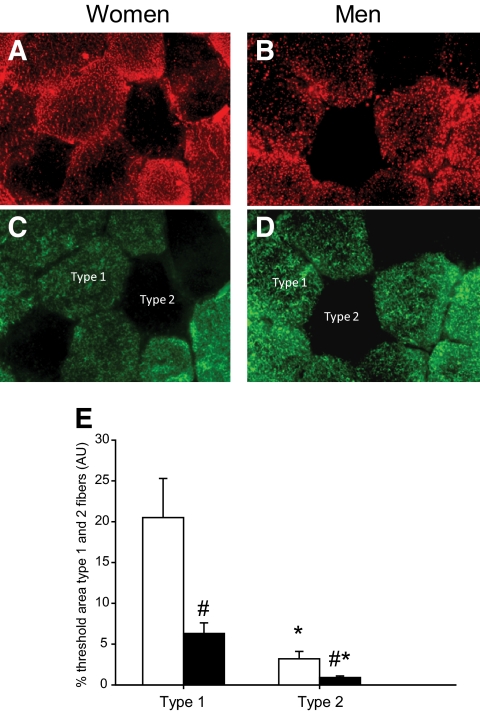
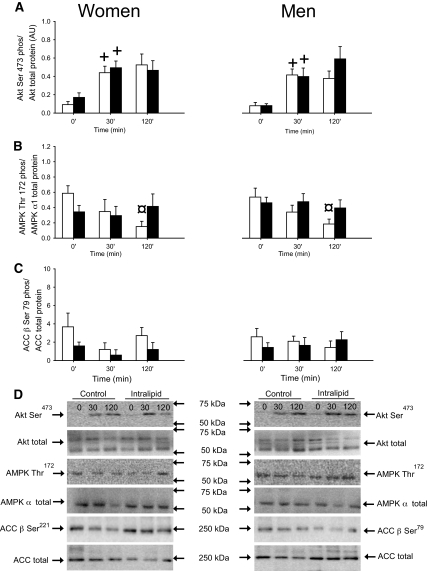
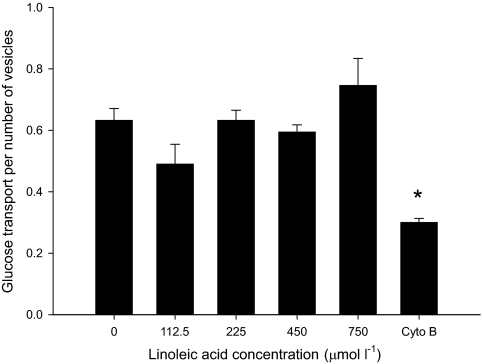
Results: Intralipid infusion reduced whole-body glucose infusion rate by 26% in women and 38% in men (P < 0.05), and insulin-stimulated leg glucose uptake was reduced significantly less in women (45%) than men (60%) after intralipid infusion. Hepatic glucose production was decreased during the clamp similarly in women and men irrespective of intralipid infusion. Intralipid did not impair insulin or AMPK signaling in muscle and subcutaneous fat, did not cause accumulation of muscle lipid intermediates, and did not impair insulin-stimulated glycogen synthase activity in muscle or increase plasma concentrations of inflammatory cytokines. In vitro glucose transport in giant sarcolemmal vesicles was not decreased by acute exposure to fatty acids. Leg lactate release was increased and respiratory exchange ratio was decreased by intralipid.

Conclusions: Intralipid infusion causes less insulin resistance of muscle glucose uptake in women than in men. This insulin resistance is not due to decreased canonical insulin signaling, accumulation of lipid intermediates, inflammation, or direct inhibition of GLUT activity. Rather, a higher leg lactate release and lower glucose oxidation with intralipid infusion may suggest a metabolic feedback regulation of glucose metabolism.


Figures

FIG. 1.
FIG. 1.
Glucose infusion rate and insulin-stimulated leg glucose uptake in women and men in the control (□) and intralipid (■) trial. A: Glucose infusion rate the last 30 min of the clamp. B: Delta glucose infusion rate the last 120 min of the clamp, expressed as the difference between the control and the intralipid trial. C: Insulin-stimulated leg glucose uptake during the 120-min clamp in the control trial. D: Insulin-stimulated leg glucose uptake during the 120-min clamp in the intralipid trial. E: Insulin-stimulated leg glucose uptake the last 30 min of the clamp. F: Delta insulin-stimulated leg glucose uptake the last 30 min of the clamp expressed as the difference between the control and the intralipid trial. *P < 0.05 vs. control trial, #P < 0.05 vs. women. Data are means ± SE; n = 16.
FIG. 2.
FIG. 2.
IRS-1–associated PI 3-kinase activity, Akt Thr308 and Ser473 phosphorylation/Akt total protein expression, AS160 phosphorylation/total AS160 protein expression, and AMPK Thr172 phosphorylation/AMPK α2 total protein expression in the vastus lateralis muscle in women and men in the control (□) and intralipid (■) trial. A: IRS-1–associated PI 3-kinase activity. B: Akt Thr308 phosphorylation/Akt total protein expression. C: Akt Ser473 phosphorylation/Akt total protein expression. D: AS160 phosphorylation/total AS160 protein expression. E: AMPK Thr172 phosphorylation/AMPK α2 total protein expression. F: Representative immunoblots. +P < 0.05 vs. previous time point. Values are means ± SE; n = 16. AU, arbitrary units.
FIG. 3.
FIG. 3.
HKII protein expression, HKII mRNA, glycogen synthase activity, GLUT4, and Munc 18c protein expression in the vastus lateralis muscle in women and men in the control (□) and intralipid (■) trial. A: HKII protein expression. B: HKII mRNA. C: Glycogen synthase activity. D: GLUT4 protein expression. E: Munc 18c protein expression. F: Representative immunoblots. ++P < 0.001 vs. previous time point. #P < 0.05 vs. women. Values are means ± SE; n = 16. AU, arbitrary units.
FIG. 4.
FIG. 4.
IMTG measured with Oil Red O (ORO) in type 1 and type 2 fibers in women (□) and men (■). A: ORO signal in women. B. ORO signal in men. C. Myosin heavy chain (MHC) staining in women. Type 1 fibers are colored green. D: MHC staining in men. E: IMTG content (measured by ORO) in type 1 and type 2 fibers of the vastus lateralis muscle in women and men. Type 1 fibers are colored green. *P < 0.05 vs. type 1 fibers, #P < 0.05 vs. women. Values are means ± SE; n = 16. AU, arbitrary units. (A high-quality digital representation of this figure is available in the online issue.)
FIG. 5.
FIG. 5.
Akt Ser473 phosphorylation/Akt total protein expression, AMPKthr172 phosphorylation/AMPK α1 total protein expression, and ACC β Ser79/ACC β total protein expression in subcutaneous adipose tissue in women and men in the control (□) and intralipid (■) trial. A: Akt Ser473 phosphorylation/Akt total protein expression. B: AMPKthr172 phosphorylation/AMPK α1 total protein expression. C: ACC β Ser79/ACC β total protein expression. D: Representative immunoblots. +P < 0.05 vs. previous time point, ¤P < 0.05 vs. time point 0. Values are means ± SE; n = 16. AU, arbitrary units.
FIG. 6.
FIG. 6.
Glucose transport in giant sarcolemmal vesicles prepared from rat muscle after incubation of different concentrations of linoleic acid related to the number of vesicles present after the incubation and the glucose transport after inhibition with cytochalasin B (Cyto B). *P < 0.05 vs. glucose uptake when incubated with 0, 112.5, 225, 450, and 750 μmol/l linoleic acid. Values are means ± SE; n = 4.

Comment in

References

    1. Hoy AJ, Brandon AE, Turner N, Watt MJ, Bruce CR, Cooney GJ, Kraegen EW: Lipid and insulin infusion-induced skeletal muscle insulin resistance is likely due to metabolic feedback and not changes in IRS-1, Akt, or AS160 phosphorylation. Am J Physiol Endocrinol Metab 2009;297:E67–E75 - PMC - PubMed
    1. Yu C, Chen Y, Cline GW, Zhang D, Zong H, Wang Y, Bergeron R, Kim JK, Cushman SW, Cooney GJ, Atcheson B, White MF, Kraegen EW, Shulman GI: Mechanism by which fatty acids inhibit insulin activation of insulin receptor substrate-1 (IRS-1)-associated phosphatidylinositol 3-kinase activity in muscle. J Biol Chem 2002;277:50230–50236 - PubMed
    1. Boden G, Chen X, Ruiz J, White JV, Rossetti L: Mechanisms of fatty acid-induced inhibition of glucose uptake. J Clin Invest 1994;93:2438–2446 - PMC - PubMed
    1. Hoeks J, Hesselink MK, Russell AP, Mensink M, Saris WH, Mensink RP, Schrauwen P: Peroxisome proliferator-activated receptor-gamma coactivator-1 and insulin resistance: acute effect of fatty acids. Diabetologia 2006;49:2419–2426 - PubMed
    1. Itani SI, Ruderman NB, Schmieder F, Boden G: Lipid-induced insulin resistance in human muscle is associated with changes in diacylglycerol, protein kinase C, and IkappaB-alpha. Diabetes 2005;51:2005–2011 - PubMed

Publication types

MeSH terms