

OCT1 Expression in adipocytes could contribute to increased metformin action in obese subjects
- PMID: 20956498
- PMCID: PMC3012168
- DOI: 10.2337/db10-0805
OCT1 Expression in adipocytes could contribute to increased metformin action in obese subjects
Abstract
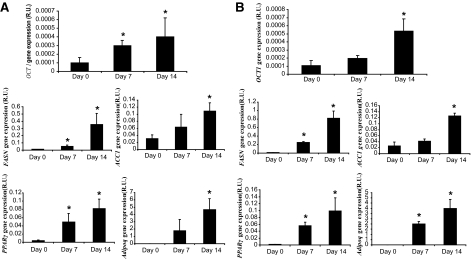
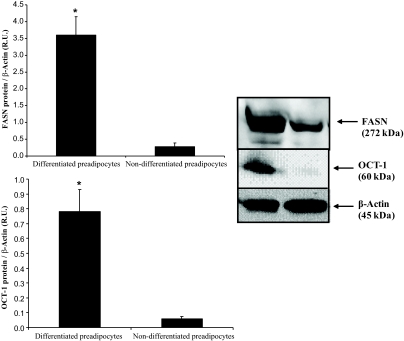
Objective: Metformin has been well characterized in vitro as a substrate of liver-expressed organic cation transporters (OCTs). We investigated the gene expression and protein levels of OCT-1 and OCT-2 in adipose tissue and during adipogenesis and evaluated their possible role in metformin action on adipocytes.
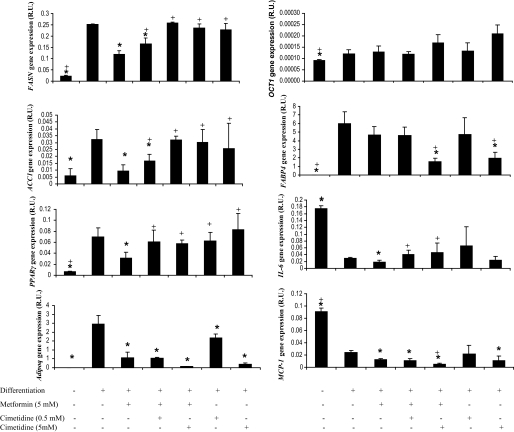
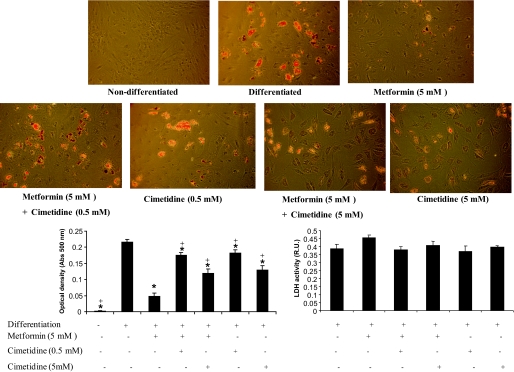
Research design and methods: OCT1 and OCT2 gene expressions were analyzed in 118 adipose tissue samples (57 visceral and 61 subcutaneous depots) and during human preadipocyte differentiation. To test the possible role of OCT1 mediating the response of adipocytes to metformin, cotreatments with cimetidine (OCT blocker, 0.5 and 5 mmol/l) and metformin were made on human preadipocytes and subcutaneous adipose tissue (SAT).
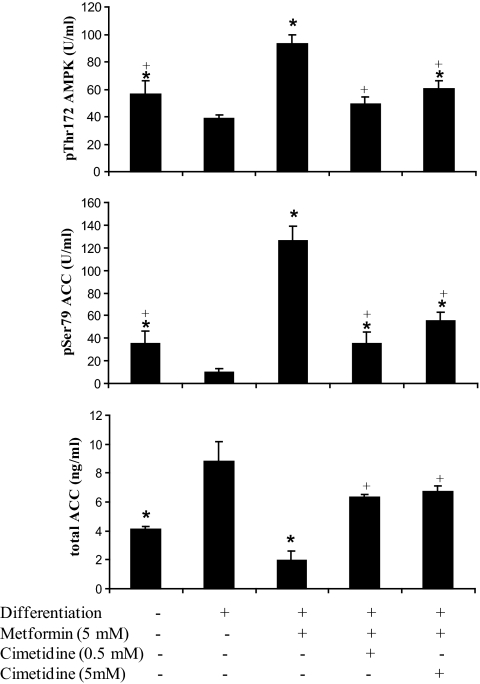
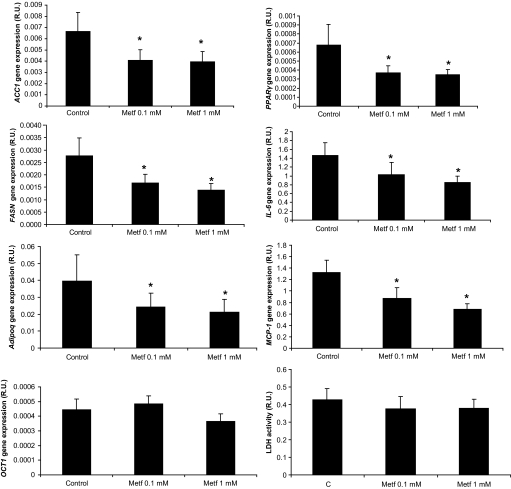
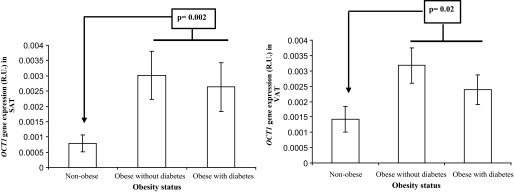
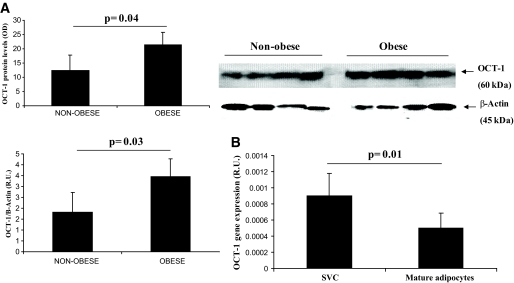
Results: OCT1 gene was expressed in both subcutaneous and visceral adipose tissue. In both fat depots, OCT1 gene expression and protein levels were significantly increased in obese subjects. OCT1 gene expression in isolated preadipocytes significantly increased during differentiation in parallel to adipogenic genes. Metformin (5 mmol/l) decreased the expression of lipogenic genes and lipid droplets accumulation while increasing AMP-activated protein kinase (AMPK) activation, preventing differentiation of human preadipocytes. Cotreatment with cimetidine restored adipogenesis. Furthermore, metformin decreased IL-6 and MCP-1 gene expression in comparison with differentiated adipocytes. Metformin (0.1 and 1 mmol/l) decreased adipogenic and inflammatory genes in SAT. OCT2 gene expression was not detected in adipose tissue and was very small in isolated preadipocytes, disappearing during adipogenesis.
Conclusions: OCT1 gene expression and protein levels are detectable in adipose tissue. Increased OCT1 gene expression in adipose tissue of obese subjects might contribute to increased metformin action in these subjects.
Figures
References
-
- Bailey CJ, Turner RC: Metformin. N Engl J Med 1996;334:574–579 - PubMed
-
- Kirpichnikov D, McFarlane SI, Sowers JR: Metformin: an update. Ann Intern Med 2002;137:25–33 - PubMed
-
- Shikata E, Yamamoto R, Takane H, Shigemasa C, Ikeda T, Otsubo K, Ieiri I: Human organic cation transporter (OCT1 and OCT2) gene polymorphisms and therapeutic effects of metformin. J Hum Genet 2007;52:117–122 - PubMed
-
- Koepsell H, Lips K, Volk C: Polyspecific organic cation transporters: structure, function, physiological roles, and biopharmaceutical implications. Pharm Res 2007;24:1227–1251 - PubMed
Publication types
MeSH terms
Substances
LinkOut - more resources
Full Text Sources
Other Literature Sources
Medical
Research Materials
Miscellaneous
