. 2011 Jan 7;286(1):309-21.
doi: 10.1074/jbc.M110.168468. Epub 2010 Oct 18.

The essential role of clathrin-mediated endocytosis in the infectious entry of human enterovirus 71

Affiliations

The essential role of clathrin-mediated endocytosis in the infectious entry of human enterovirus 71

Khairunnisa' Mohamed Hussain et al. J Biol Chem. .

Abstract

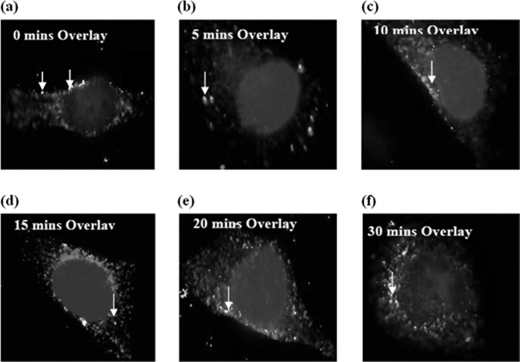
Little is currently known about the infectious entry process of human enterovirus 71 (HEV71) into host cells, which may represent potential anti-viral targeting sites. In this study a targeted small-interfering RNA (siRNA) screening platform assay was established and validated to identify and profile key cellular genes involved in processes of endocytosis, cytoskeletal dynamics, and endosomal trafficking essential for HEV71 infection. Screen evaluation was conducted via the expression of well characterized dominant-negative mutants, bioimaging studies (double-labeled immunofluorescence assays, transmission electron microscopy analysis), secondary siRNA-based dosage dependence studies, and drug inhibition assays. The infectious entry of HEV71 into rhabdomyosarcoma cells was shown to be significantly inhibited by siRNAs targeting genes associated with clathrin-mediated endocytosis (CME) that include AP2A1, ARRB1, CLTC, CLTCL1, SYNJ1, ARPC5, PAK1, ROCK1, and WASF1. The functional role of CME was verified by the observation of strong co-localization between HEV71 particles and clathrin as well as dose-dependent inhibition of HEV71 infection upon siRNA knockdown of CME-associated genes. HEV71 entry by CME was further confirmed via inhibition by dominant-negative EPS15 mutants and treatment of CME drug inhibitors, with more than 80% inhibition observed at 20 μm chlorpromazine. Furthermore, HEV71 infection was shown to be sensitive to the disruption of human genes in regulating early to late endosomal trafficking as well as endosomal acidic pH. The identification of clathrin-mediated endocytosis as the entry pathway for HEV71 infection of susceptible host cells contributes to a better understanding of HEV71 pathogenesis and enables future development of anti-viral strategies against HEV71 infection.


Figures

FIGURE 1.
FIGURE 1.
siRNA profiling of genes important for the infectious entry process of HEV71 into RD cells using the human endocytic/membrane trafficking library. HEV71-infected cells after siRNA knockdown (pink) were compared against transfection controls (purple) and are presented as the percentage of viral antigen-positive cells. The transfection controls were set up as the base line for infection and transfection efficiency. Genes that resulted in significant decreases in HEV71 infection (p ≤ 0.05) after siRNA knockdown and are involved in clathrin-mediated endocytosis are shown in green.
FIGURE 2.
FIGURE 2.
Validation of siRNA knockdown of genes involved in the infectious entry of HEV71. The experiments shown were repeated with the deconvoluted siRNA sequences (four individual siRNAs) from the Smartpool. Data displayed are representative of three independent experiments.
FIGURE 3.
FIGURE 3.
Dose-dependent knockdown of genes involved in the infectious entry of HEV71. Gene-specific siRNA against AP2A1 (a), ARPC5 (b), CLTC (c), RAB3A (d), SYNJ1 (e), and WASF1 (f) were transfected into RD cells at different concentrations (0–50 nm) and subjected to HEV71 infection. Dose-dependent reduction of HEV71 infection can be observed for these selected genes. Histograms represent the inhibition of virus entry determined by the percentage virus antigen-positive cells (with S.E. bars) against siRNA concentrations. Cell viability upon siRNA transfection was unaffected as represented by the line graphs. Western blots were also performed after treatment with siRNAs to ensure the knockdown of the specific protein expression. Dose-dependent reductions of protein expression were observed for the indicated genes corresponding to the concentrations of the transfected siRNAs (upper panels). At the concentration of 25 nm transfected siRNA for the respective proteins, more than 60% reduction (as measured by densitometry) can be observed when compared with the mock-transfected samples. The blots were also re-probed with β-actin-specific antibody. which served as a gel-loading control (lower panels).
FIGURE 4.
FIGURE 4.
Bio-imaging analysis of the interaction of clathrin molecules with HEV71 particles. A double-labeled immunofluorescence assay was performed to track the entry process and cellular localization of HEV71 within infected cells at fixed time points. a, no co-localization between HEV71 viral particles (arrows) and clathrin molecules was observed at 0-min p.i. b, HEV71 viral particles began co-localizing with clathrin molecules (indicated by light gray arrows) at 5 min p.i. c, more co-localization occurred at 10-min p.i. d, co-localization was observed forming around the perinuclear region at 15 min p.i. e, enhanced co-localization was seen at 20 min p.i. f, co-localization between HEV71 viral particles and clathrin molecules was completed at 30 min p.i. Cell nuclei were stained blue with DAPI.
FIGURE 5.
FIGURE 5.
Ultrastructural analysis of HEV71 infectious entry. To visualize synchronized HEV71 entry, RD cells were incubated with HEV71 at 4 °C for 1 h, after which they were warmed to 37 °C before processing for transmission electron microscopy analysis. a, at 0-min of warming to 37 °C, HEV71 particles (indicated by gray arrows) were seen attached to the cell surface. b, at 5 min after warm-up, HEV71 particles were observed within invaginations of the plasma membrane (clathrin pits indicated by white arrows). c, at 10 min of warm-up, HEV71 particles were seen enclosed within clathrin-coated vesicles. d, at 15–20 min of warm-up, vesicles containing numerous HEV71 virus particles were observed.
FIGURE 6.
FIGURE 6.
Inhibition of HEV71 entry into cells by dominant negative Eps15 mutants. RD cells were first transfected with pEGFP-Eps15Δ95/295 plasmid, pEGFP-Eps15DIIIΔ2, or pEGFP-C2 plasmid for 48 h before HEV71 infection at 4 °C for 1 h to allow for virus binding. The temperature was subsequently shifted rapidly to 37 °C for internalization, and the cells were then processed for immunofluorescence staining and microscopic imaging. a, HEV71 viral particles (arrows) were observed to attach on the surface of cell expressing Eps15 dominant negative mutant of pEGFP-Eps15Δ95/295. HEV71 viral particles were observed within the cytoplasm of pEGFP-Esp15DIIIΔ2 (b)- and pEGFP-C2 (c)-expressing cells. The expression of GFP-tagged plasmids emitted the green color observed (indicated here as white dots). Cell nuclei were stained blue with DAPI (indicated here in dark gray). d, the histogram represents the inhibition of virus entry determined by the percentage virus antigen-positive cells (with S.E. bars) against pEGFP-Eps15Δ95/295 plasmid (dominant-negative mutant), pEGFP-Esp15DIIIΔ2, pEGFP-C2 plasmid (internal control), and mock-transfection control. The plots shown are representative of three independent experiments. The asterisk indicates p values of ≤0.05 by Student's t test.
FIGURE 7.
FIGURE 7.
Effects of treatment of clathrin-mediated endocytic inhibitors on HEV71-infected RD cells. RD cells were pretreated with varying concentrations of chlorpromazine (2, 10, 20, and 30 μm) (a) and cytochalasin B (0.2, 1, 2, 3, and 4 μm) (b) for 2 h at 37 °C before HEV71 infection. At 12 h p.i., the infected cells were processed for immunofluorescence assay. Histograms represent the inhibition of virus entry determined by the percentage virus antigen-positive cells (with S.E. bars) against drug concentrations. Cell viability upon drug treatments was unaffected as represented by the line graphs. The plots shown are representative of three independent experiments. The asterisk indicates p values of ≤0.05 by Student's t test. UT, untreated cells; SC, solvent control.
FIGURE 8.
FIGURE 8.
Effects of treatment of caveolae-mediated endocytic inhibitors (a–c) and macropinocytic inhibitor (d) on HEV71-infected RD cells. RD cells were pretreated with varying concentrations of filipin (0.5, 1, 1.5, 2, and 3 μg/ml) (a), nystatin (5, 10, 20, and 40 μm) (b), methyl-β-cyclodextrin (2.5, 5, 7.5, and 10 mm) (c), and EIPA (10, 25, 50, and 100 μm) (d) for 2 h at 37 °C before HEV71 infection. At 12 h p.i., the infected cells were processed for immunofluorescence assay. Histograms represent the inhibition of virus entry determined by the percentage virus antigen-positive cells (with S.E. bars) against drug concentrations. Cell viability upon drug treatments was unaffected as represented by the line graphs. The plots shown are representative of three independent experiments. The asterisk indicates p values of ≤0.05 by Student's t test. UT, untreated cells; SC, solvent control.
FIGURE 9.
FIGURE 9.
Endocytic trafficking of internalized HEV71 particles within cells. a, shown is co-localization between HEV71 viral particles and early endosomes (arrows) at 15 min p.i. (as observed in the Overlay, last upper panel). The first upper panel represents the DAPI-stained cell nuclei, the second upper panel represents FITC-stained HEV71 viral particles, and the third upper panel represents TR-stained early endosomes. No co-localization was observed between HEV71 viral particles (second lower panel) and late endosomes (third lower panel) at 15 min p.i. (as observed in the Overlay, last lower panel). b, co-localization between HEV71 viral particles and late endosomes (arrows) at 30 min p.i. (as observed in the Overlay, last upper panel) is shown. The first upper panel represents the DAPI-stained cell nuclei, the second upper panel represents FITC-stained HEV71 viral particles, and the third upper panel represents TR-stained late endosomes. No co-localization was observed between HEV71 viral particles (second lower panel) and early endosomes (third lower panel) at 30 min p.i. (as observed in the Overlay, last lower panel).
FIGURE 10.
FIGURE 10.
Effects of treatment of vacuolar proton-ATPase inhibitors on HEV71-infected RD cells. RD cells were pretreated with varying concentrations of bafilomycin A1 (0.01, 0.05, 0.1, 0.5, and 1 μm) (a) and concanamycin A (20, 40, 60, 80, and 100 nm) (b) for 2 h at 37 °C before HEV71 infection. At 12 h p.i., the infected cells were processed for immunofluorescence assay. Histograms represent the inhibition of virus entry determined by the percentage virus antigen-positive cells (with S.E. bars) against drug concentrations. Cell viability upon drug treatments was unaffected as represented by the line graphs. The plots shown are representative of three independent experiments. The asterisk indicates p values of ≤0.05 by Student's t test. UT, untreated cells; SC, solvent control.

Similar articles

Cited by

References

    1. Marsh M., Helenius A. (2006) Cell 124, 729–740 - PMC - PubMed
    1. Sieczkarski S. B., Whittaker G. R. (2002) J. Gen. Virol. 83, 1535–1545 - PubMed
    1. Harrison S. C. (2008) Nat. Struct. Mol. Biol. 15, 690–698 - PMC - PubMed
    1. Radtke K., Döhner K., Sodeik B. (2006) Cell. Microbiol. 8, 387–400 - PubMed
    1. Isaacson M. K., Juckem L. K., Compton T. (2008) Curr. Top. Microbiol. Immunol. 325, 85–100 - PubMed

Publication types