. 2010 Dec 31;285(53):41911-20.
doi: 10.1074/jbc.M110.179093. Epub 2010 Oct 18.

Binding of calmodulin to the HIV-1 matrix protein triggers myristate exposure

Affiliations

Binding of calmodulin to the HIV-1 matrix protein triggers myristate exposure

Ruba H Ghanam et al. J Biol Chem. .

Abstract

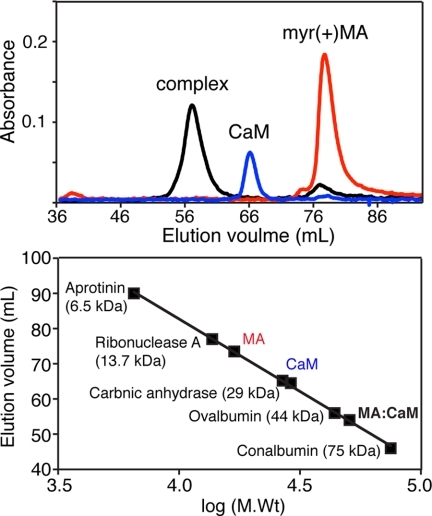
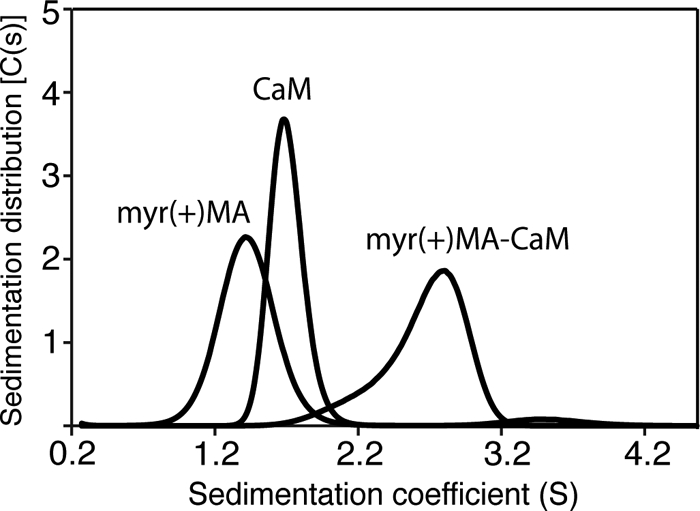
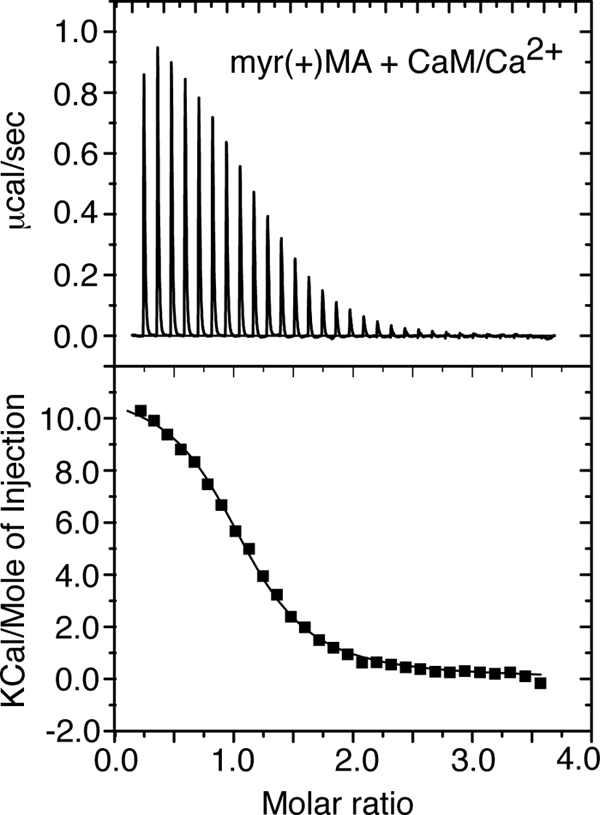
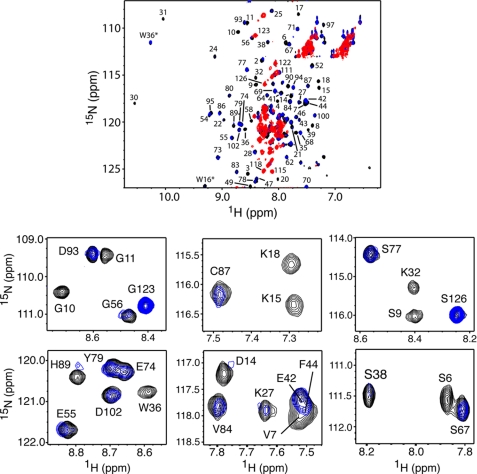
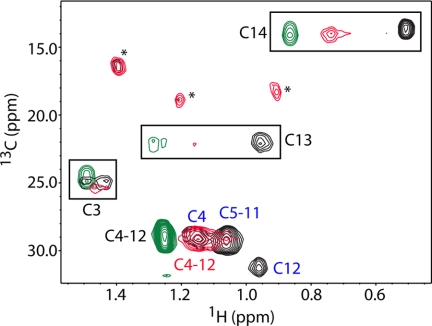
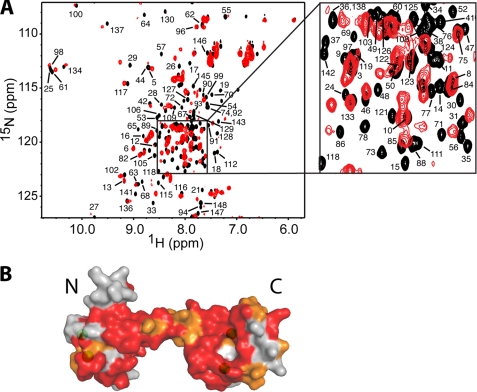
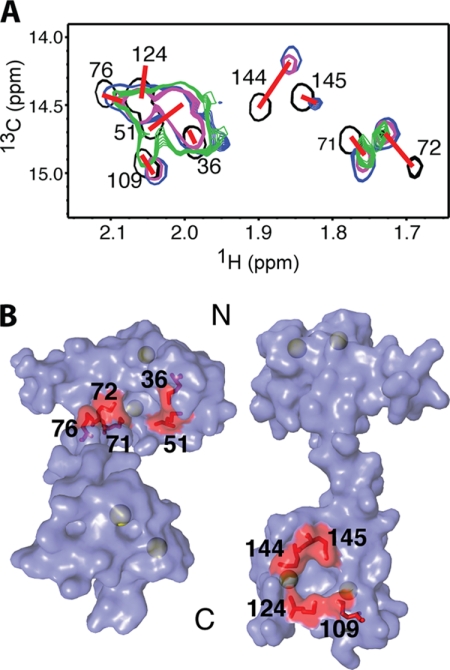
Steady progress has been made in defining both the viral and cellular determinants of retroviral assembly and release. Although it is widely accepted that targeting of the Gag polypeptide to the plasma membrane is critical for proper assembly of HIV-1, the intracellular interactions and trafficking of Gag to its assembly sites in the infected cell are poorly understood. HIV-1 Gag was shown to interact and co-localize with calmodulin (CaM), a ubiquitous and highly conserved Ca(2+)-binding protein expressed in all eukaryotic cells, and is implicated in a variety of cellular functions. Binding of HIV-1 Gag to CaM is dependent on calcium and is mediated by the N-terminally myristoylated matrix (myr(+)MA) domain. Herein, we demonstrate that CaM binds to myr(+)MA with a dissociation constant (K(d)) of ∼2 μm and 1:1 stoichiometry. Strikingly, our data revealed that CaM binding to MA induces the extrusion of the myr group. However, in contrast to all known examples of CaM-binding myristoylated proteins, our data show that the myr group is exposed to solvent and not involved in CaM binding. The interactions between CaM and myr(+)MA are endothermic and entropically driven, suggesting that hydrophobic contacts are critical for binding. As revealed by NMR data, both CaM and MA appear to engage substantial regions and/or undergo significant conformational changes upon binding. We believe that our findings will provide new insights on how Gag may interact with CaM during the HIV replication cycle.


Figures

FIGURE 1.
FIGURE 1.
Characterization of the MA·CaM complex by gel filtration chromatography. Top, chromatographic separation of myr(+)MA, CaM, and myr(+)MA·CaM in the presence of calcium. Bottom, gel filtration calibration assay showing mobility of CaM, MA, and the CaM·MA complex.
FIGURE 2.
FIGURE 2.
Sedimentation coefficient distributions (C(s)) obtained from the sedimentation profiles for CaM, myr(+)MA, and the myr(+)MA·CaM complex.
FIGURE 3.
FIGURE 3.
Upper panel, ITC data obtained upon titration of CaM (402 μm) into myr(+)MA (20 μm). The data best fit one-site binding mode and afforded a Kd of 1.9 μm (lower panel).
FIGURE 4.
FIGURE 4.
Top panel, overlay of two-dimensional 1H-15N HSQC spectra obtained for a uniformly 15N-labeled myr(+)MA upon titration with unlabeled CaM. Black, myr(+)MA·CaM ratio of 0:1; blue, myr(+)MA·CaM ratio of 0.25:1; red, myr(+)MA·CaM ratio of 1:1. Bottom panel, selected 1H-15N HSQC signals from the top panel are shown to emphasize the significant loss of signal intensity in the N-terminal domain of MA upon CaM binding at 0.25:1 stoichiometry.
FIGURE 5.
FIGURE 5.
Overlay of two-dimensional 1H-13C HMQC spectra obtained for myr(+)MA containing a 13C-labeled myr group in the unbound (black) and CaM-bound (red) states. For comparison, a spectrum of free myristic acid is shown (green). An asterisk indicates a breakthrough of 1H-13C signals from CaM.
FIGURE 6.
FIGURE 6.
A, overlay of two-dimensional 1H-15N HSQC spectra obtained for 15N-labeled CaM in the unbound state (black) and in complex with unlabeled myr(+)MA at 1. 4:1 (MA:CaM) (red). B, surface representation of the CaM structure of (Protein Data Base code 3CLN). Residues that exhibited substantial chemical shift changes (> 0.1 ppm) or signal loss are colored in red, whereas those modestly perturbed (< 0.1 ppm) are colored in orange. Calcium ions are colored in green.
FIGURE 7.
FIGURE 7.
A, overlay of two-dimensional 1H-13C HMQC spectra obtained for 13C-labeled CaM as a function of added unlabeled myr(+)MA. Black, myr(+)MA·CaM ratio of 0:1; blue, myr(+)MA·CaM ratio of 0.25:1; magenta, myr(+)MA·CaM ratio of 0.5:1; green, myr(+)MA·CaM ratio of 1:1. B, surface representation of the CaM structure (Protein Data Base code 3CLN) showing the nine Met residues on the N- and C-terminal lobes (red). Calcium ions are colored in green.

Similar articles

Cited by

References

    1. Adamson C. S., Freed E. O. (2007) Adv. Pharmacol. 55, 347–387 - PubMed
    1. Ganser-Pornillos B. K., Yeager M., Sundquist W. I. (2008) Curr. Opin. Struct. Biol. 18, 203–217 - PMC - PubMed
    1. Bieniasz P. D. (2009) Cell Host Microbe 5, 550–558 - PMC - PubMed
    1. Ono A. (2010) Biol. Cell 102, 335–350 - PMC - PubMed
    1. Ono A. (2010) Vaccine 28, Suppl. 2, B55–B59 - PMC - PubMed

Publication types