. 2010 Dec 17;285(51):40333-41.
doi: 10.1074/jbc.M110.151076. Epub 2010 Oct 18.

Role of interferon {alpha} (IFN{alpha})-inducible Schlafen-5 in regulation of anchorage-independent growth and invasion of malignant melanoma cells

Affiliations

Role of interferon {alpha} (IFN{alpha})-inducible Schlafen-5 in regulation of anchorage-independent growth and invasion of malignant melanoma cells

Efstratios Katsoulidis et al. J Biol Chem. .

Abstract

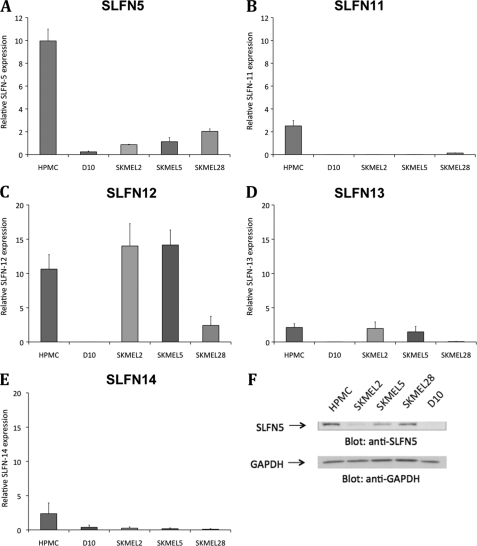
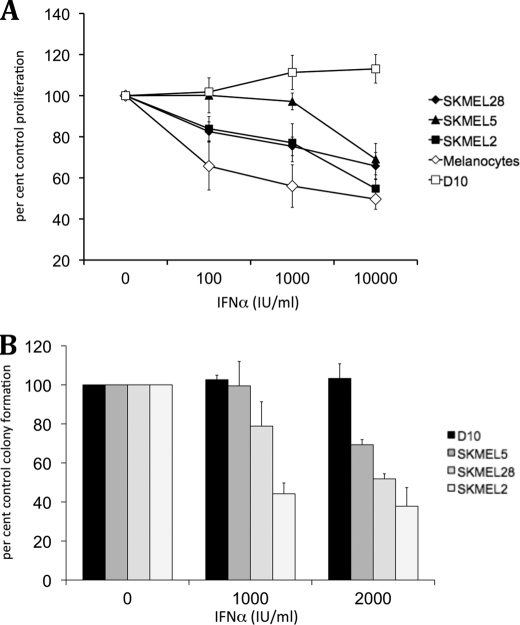
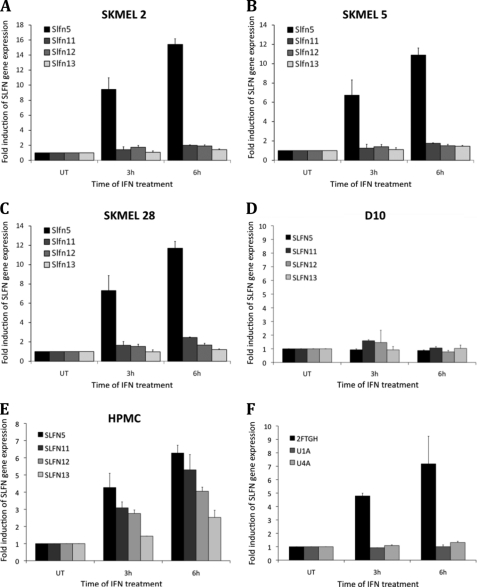
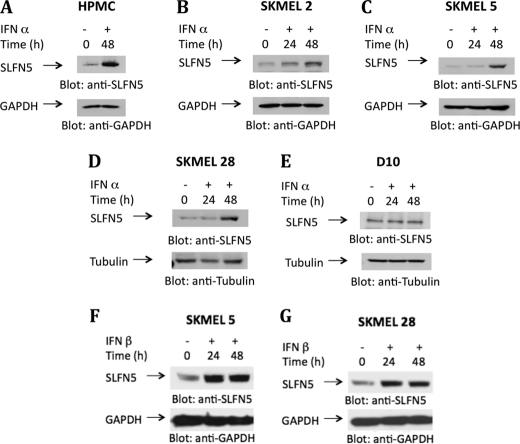
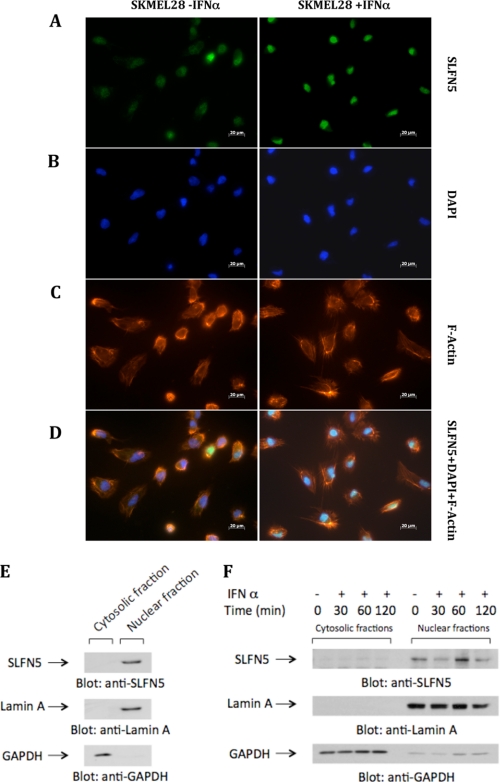
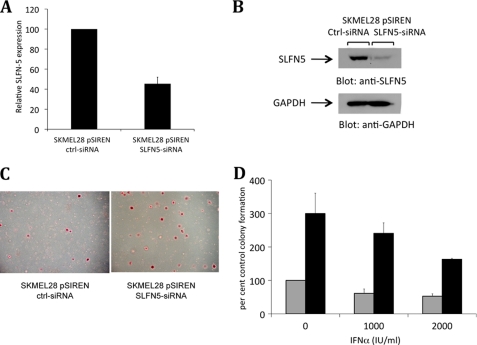
IFNα exerts potent inhibitory activities against malignant melanoma cells in vitro and in vivo, but the mechanisms by which it generates its antitumor effects remain unknown. We examined the effects of interferon α (IFNα) on the expression of human members of the Schlafen (SLFN) family of genes, a group of cell cycle regulators that mediate growth-inhibitory responses. Using quantitative RT-real time PCR, we found detectable basal expression of all the different human SLFN genes examined (SLFN5, SLFN11, SLFN12, SLFN13, and SLFN14), in malignant melanoma cells and primary normal human melanocytes, but SLFN5 basal expression was suppressed in all analyzed melanoma cell lines. Treatment of melanoma cells with IFNα resulted in induction of expression of SLFN5 in malignant cells, suggesting a potential involvement of this gene in the antitumor effects of IFNα. Importantly, stable knockdown of SLFN5 in malignant melanoma cells resulted in increased anchorage-independent growth, as evidenced by enhanced colony formation in soft agar assays. Moreover, SLFN5 knockdown also resulted in increased invasion in three-dimensional collagen, suggesting a dual role for SLFN5 in the regulation of invasion and anchorage-independent growth of melanoma cells. Altogether, our findings suggest an important role for the SLFN family of proteins in the generation of the anti-melanoma effects of IFNα and for the first time directly implicate a member of the human SLFN family in the regulation of cell invasion.


Figures

FIGURE 1.
FIGURE 1.
Relative expression of human SLFN genes in primary melanocytes and melanoma cell lines. A–E, RNA from human primary melanocytes (HPMC) and the malignant melanoma cell lines D10, SKMEL2, SKMEL5, and SKMEL28 was isolated, and the expression of SLFN5 (A), SLFN11 (B), SLFN12 (C), SLFN13 (D), and SLFN 14 (E) over GAPDH was analyzed via RT-real time PCR using specific primers and GAPDH as an internal control. To be able to compare the relative expression of SLFN genes in different cells, a universal human Stratagene reference RNA was used, which was also normalized to GAPDH in the samples. Means ± S.E. of three independent experiments are shown. F, lysates from human primary melanocytes or the indicated cell lines were separated by SDS-PAGE and immunoblotted with antibodies against SLFN5 or GAPDH, as indicated.
FIGURE 2.
FIGURE 2.
Effects of IFNα on proliferation and anchorage-independent growth of malignant melanoma cells. A, normal melanocytes, SKMEL2, SKMEL5, SKMEL28, and D10 melanoma cells were incubated with the indicated concentrations (IU/ml) of IFNα, and cellular proliferation was assessed after 5 days using 3-(4,5-dimethylthiazol-2-yl)-2,5-diphenyltetrazolium bromide assays. Data shown represent means ± S.E. of three independent experiments. B, SKMEL2, SKMEL28, SKMEL5, and D10 cells were plated in soft agar in the presence or absence of the indicated concentrations (IU/ml) of IFNα. Colony formation was scored after 7 days. Data are expressed as percent control colony formation for untreated cells. Means ± S.E. of three independent experiments are shown.
FIGURE 3.
FIGURE 3.
IFNα-inducible human SLFN gene expression. A–E, melanoma cell lines SKMEL2 (A), SKMEL5 (B), SKMEL28 (C), D10 (D), and normal human primary melanocytes (HPMC) (E) were treated with IFNα for 3 or 6 h, as indicated. RNA was isolated, and induction of SLFN5, SLFN11, SLFN12, and SLFN13 mRNA gene expression was analyzed by quantitative RT-real time PCR. Data are expressed as fold increase over untreated (UT) controls. F, U1A, U4A, or parental 2FTGH cells were treated with IFNα, and SLFN5 mRNA gene expression was analyzed, using GAPDH as an internal control. Data shown represent means ± S.E. of three independent experiments for A–C and two independent experiments for D, E, and F.
FIGURE 4.
FIGURE 4.
Type I IFNα-inducible human SLFN protein expression. Human primary melanocytes (HPMC) (A) and the melanoma cell lines SKMEL2 (B), SKMEL5 (C and F), SKMEL28 (D and G), and D10 (E) were treated with IFNα or IFNβ or were left untreated, as indicated. Cells were lysed, proteins resolved by SDS-PAGE, and immunoblotted with an antibody against SLFN5. The same blots were re-probed with anti-GAPDH or anti-tubulin antibodies, as indicated, to control for protein loading.
FIGURE 5.
FIGURE 5.
Subcellular localization of SLFN5, as shown by immunofluorescence and immunoblotting after separation of nuclear and cytosolic fractions. A–D, SKMEL28 cells were incubated in the presence or absence of IFNα for 48 h, as indicated. Cells were fixed, permeabilized, and incubated with an antibody against SLFN5 followed by Alexa Fluor 488 secondary antibody (A), DAPI (B), or phalloidin 586 (C). Overlay of the fluorescence signals is shown in D. E and F, nuclear and cytosolic fractions were isolated from lysates of primary melanocytes (E) or from lysates of SKMEL5 cells that had been treated with IFNα for the indicated times (F). Equal amounts of protein were separated by SDS-PAGE, and fractions were analyzed for subcellular localization of SLFN5 via immunoblotting. GAPDH and nuclear lamin A were analyzed in parallel to confirm proper separation of fractions.
FIGURE 6.
FIGURE 6.
Stable knockdown of SLFN5 enhances anchorage-independent growth of SKMEL28 melanoma cells. A, expression of SLFN5 mRNA in pSIREN-SLFN5 siRNA or pSIREN-control-siRNA SKMEL28 cells was determined by real time RT-PCR using GAPDH as an internal control. The data are presented as percentage of SLFN5 expression in pSIREN ZsGreen control-siRNA cells and represent the means ± S.E. of four experiments. B, cell lysates from pSIREN SLFN5-siRNA or control-siRNA SKMEL28 cells were resolved by SDS-PAGE and immunoblotted with an anti-SLFN5 antibody. The same blot was then re-probed with an anti-GAPDH antibody to control for protein loading. C, equal numbers of SKMEL28-pSIREN SLFN5-siRNA or SKMEL28-pSIREN ctrl-siRNA cells were plated in soft agar, and colony formation was assessed after 7 days of culture in the presence or absence of IFNα. Representative areas show colony formation of SKMEL28-pSIREN SLFN5-siRNA and SKMEL28-pSIREN ctrl-siRNA cells in soft agar plates stained with crystal violet dye. D, colonies derived from untreated or IFNα-treated cells were counted, and results are expressed as percentages of colony formation of untreated SKMEL28 pSIREN-ctrl-siRNA cells. Data shown represent means ± S.E. of three independent experiments, including the one shown in C. Gray bars, pSIREN-ctrl-siRNA SKMEL28 cells; black bars, pSIREN-SLFN5-siRNA SKMEL28 cells.
FIGURE 7.
FIGURE 7.
Stable knockdown of SLFN5 enhances invasion of SKMEL28 melanoma cells in collagen. Equal numbers of SKMEL28 pSIREN SLFN5-siRNA and SKMEL28 pSIREN ctrl-siRNA cells were used in a collagen invasion assay. Cells were plated in a collagen core surrounded by an additional layer of collagen. Invading cells actively invaded away from the core into the surrounding collagen. Single cell invasion of SKMEL28 pSIREN SLFN5-siRNA and SKMEL28 pSIREN ctrl-siRNA cells was analyzed by measuring the distance between the cell border forming the core and the individual cells that invaded the furthest after 2–4 days of incubation. A, representative areas showing cell invasion of SKMEL28 pSIREN SLFN5-siRNA and SKMEL28 pSIREN ctrl-siRNA cells in collagen stained with crystal violet dye are shown. B, invasion distance was measured using the Carl-Zeiss AxioVision software tool. Mean distance ± S.D. from the cell border is shown in μm (B).

Similar articles

Cited by

References

    1. Pestka S., Langer J. A., Zoon K. C., Samuel C. E. (1987) Annu. Rev. Biochem. 56, 727–777 - PubMed
    1. Katze M. G., He Y., Gale M., Jr. (2002) Nat. Rev. Immunol. 2, 675–687 - PubMed
    1. Parmar S., Platanias L. C. (2003) Curr. Opin Oncol. 15, 431–439 - PubMed
    1. Kirkwood J. M., Strawderman M. H., Ernstoff M. S., Smith T. J., Borden E. C., Blum R. H. (1996) J. Clin. Oncol. 14, 7–17 - PubMed
    1. Kirkwood J. M., Ibrahim J. G., Sondak V. K., Richards J., Flaherty L. E., Ernstoff M. S., Smith T. J., Rao U., Steele M., Blum R. H. (2000) J. Clin. Oncol. 18, 2444–2458 - PubMed

Publication types

MeSH terms