. 2010 Dec 24;285(52):41074-86.
doi: 10.1074/jbc.M110.145862. Epub 2010 Oct 18.

Hepatitis B virus induces expression of antioxidant response element-regulated genes by activation of Nrf2

Affiliations

Hepatitis B virus induces expression of antioxidant response element-regulated genes by activation of Nrf2

Stephanie Schaedler et al. J Biol Chem. .

Abstract

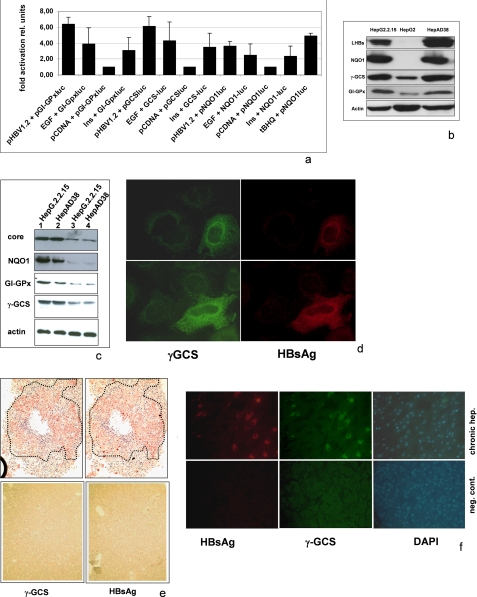
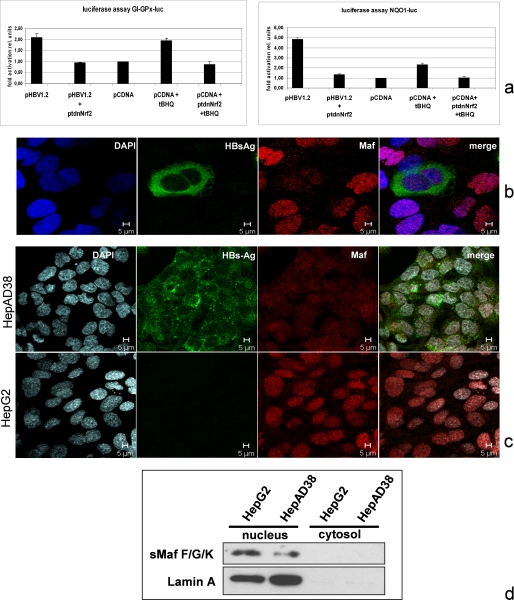
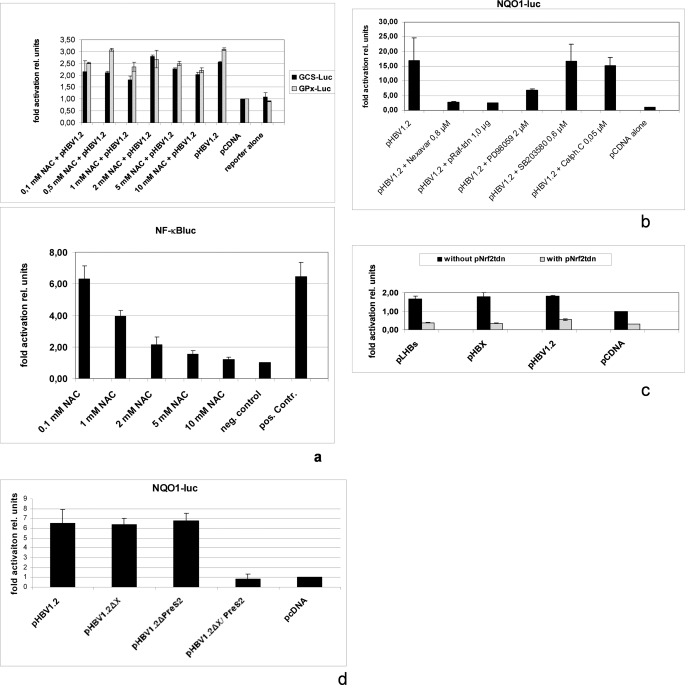
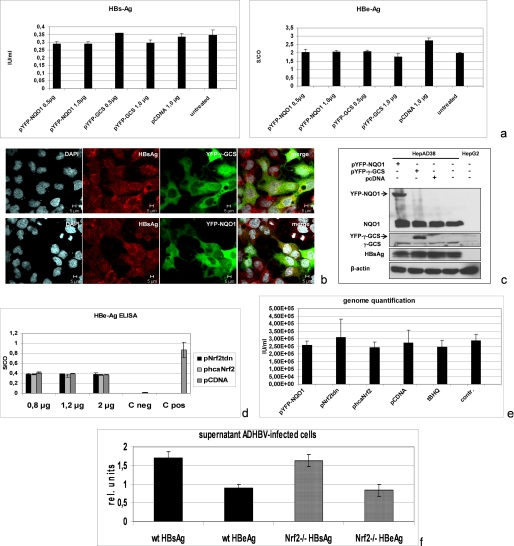
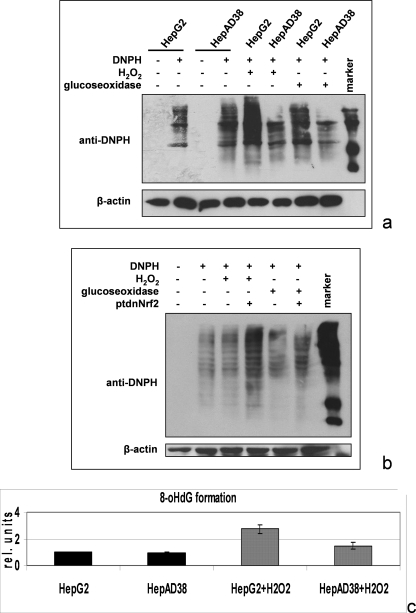
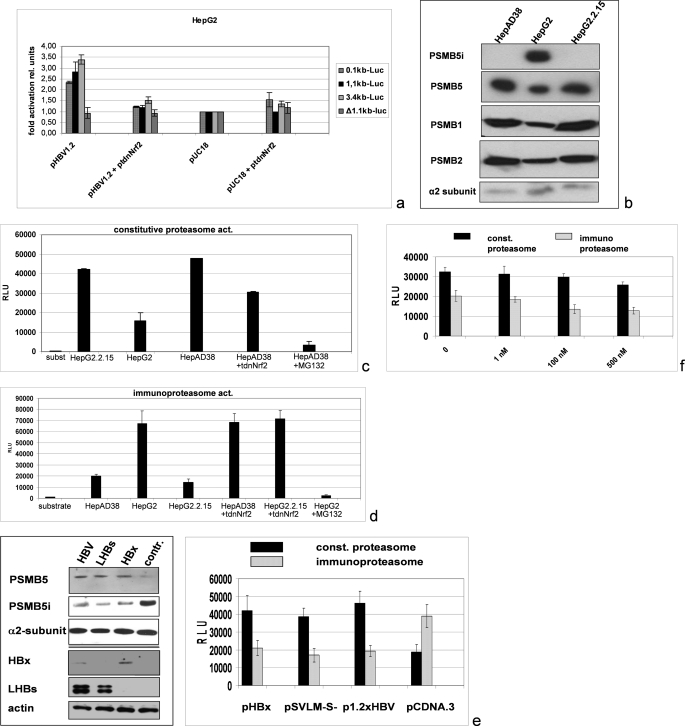
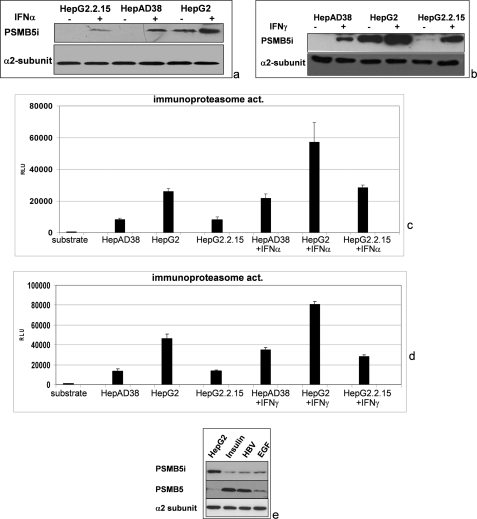
The expression of a variety of cytoprotective genes is regulated by short cis-acting elements in their promoters, called antioxidant response elements (AREs). A central regulator of ARE-mediated gene expression is the NF-E2-related factor 2 (Nrf2). Human hepatitis B virus (HBV) induces a strong activation of Nrf2/ARE-regulated genes in vitro and in vivo. This is triggered by the HBV-regulatory proteins (HBx and LHBs) via c-Raf and MEK. The Nrf2/ARE-mediated induction of cytoprotective genes by HBV results in a better protection of HBV-positive cells against oxidative damage as compared with control cells. Furthermore, there is a significantly increased expression of the Nrf2/ARE-regulated proteasomal subunit PSMB5 in HBV-positive cells that is associated with a decreased level of the immunoproteasome subunit PSMB5i. In accordance with this finding, HBV-positive cells display a higher constitutive proteasome activity and a decreased activity of the immunoproteasome as compared with control cells even after interferon α/γ treatment. The HBV-dependent induction of Nrf2/ARE-regulated genes might ensure survival of the infected cell, shape the immune response to HBV, and thereby promote establishment of the infection.


Figures

FIGURE 1.
FIGURE 1.
HBV-dependent induction of ARE-regulated genes. a, reporter gene assay in HepG2 cells cotransfected with pHBV1.2 (0.8 μg) and luciferase reporter constructs (0.2 μg) harboring the NQO1, GI-GPx, or γ-GCS-derived ARE sequences. Stimulation with tBHQ served as positive control. Moreover, cells were stimulated by the addition of EGF (10 ng/ml) or insulin (50 nm) for 12 h. Cotransfection with pCDNA.3 served as control and was set as 1. The error bars represent the standard deviation. rel units, relative units. b, Western blot analysis of cellular lysates derived from HepG2.215, HepG2, or HepAD38 cells using NQO1-, γ-GCS-, or GI-GPx-specific antisera. Expression of the HBV genome was demonstrated by a LHB-specific antiserum (MA18/7). c, Western blot analysis of cellular lysates from HepG2.215 or HepAD38 cells transfected with HBV-specific siRNA (lanes 3 and 4) or scrambled control siRNA (lanes 1 and 2) using NQO1-, γ-GCS-, or GI-GPx-specific antisera. Expression of the HBV genome was demonstrated by a core-specific antiserum. d, double immunofluorescence microscopy (200-fold magnification) of formaldehyde-fixed HBV-infected primary human hepatocytes stained with anti-LHBs(MA18–7) (red) and anti-γ-GCS (green). e, immunohistochemistry of consecutive sections of paraffin-embedded liver samples derived from an HBV patient with an acute hepatitis (hep.) B infection (upper panels) stained with anti-HBs (right panel) and anti-γ-GCS (left panel). The HBs-positive cells in the consecutive sections are marked by dotted lines. A liver sample from an HBV-negative patient (lower panels) served as negative control (neg. cont). f, double immunofluorescence microscopy of paraffin-embedded liver samples derived from an HBV patient with a chronic hepatitis B infection (upper panels) stained with anti-HBs (red) and anti-γ-GCS (green). The nuclei are visualized with DAPI (blue). A liver sample from an HBV-negative patient (lower panels) served as negative control.
FIGURE 2.
FIGURE 2.
Integrity of Nrf2 is required for the HBV-dependent induction of ARE-regulated genes. a, reporter gene assay in HepG2 cells cotransfected with pHBV1.2 (0.8 μg) and pNQO1luc (0.2 μg) luciferase reporter construct or pHBV1.2 (0.4 μg) and pGI-GPxluc (0.2 μg). Nrf2 activity was inhibited by cotransfection of ptdnNrf2 (0.4 μg); cotransfection of pCDNA.3 (0.4 μg) served as control and was set as 1. Stimulation with tBHQ served as a positive control. Activities, shown as multiples of induction, are mean values from three independent experiments. The error bars represent the standard deviation. rel units, relative units. b and c, confocal laser scanning immunofluorescence microscopy (630-fold magnification) of formaldehyde-fixed Huh7.5 cells that were transfected with pHBV1.2 (b) or of HepAD38 and HepG2 cells (c). The immunofluorescence staining was performed using the polyclonal small Maf-specific serum (red fluorescence) and the LHBs-specific antibody MA18/7; nuclei were stained with DAPI. d, Western blot analysis of the nuclear and cytosolic fraction derived from HepG2 or HepAD38 cells using a sMaf-specific antiserum. Lamin A was used as a nuclear marker.
FIGURE 3.
FIGURE 3.
HBV-dependent activation of Nrf2/ARE-regulated genes requires c-Raf. a, reporter gene assay in HepG2 cells cotransfected with pHBV1.2 (0.4 μg) and luciferase reporter constructs pγ-GCSluc (0.2 μg) or pGI-GPxluc (0.2 μg). The vector pCDNA.3 (0.4 μg) served as control and was set as 1. N-acetyl-l-cysteine (NAC) was added to the medium and served as radical scavenger. In the lower panel, functionality of NAC was shown by inhibition of the H2O2-dependent activation of the NF-κB reporter construct. HepG2 cells were transfected with a luciferase reporter construct 2×NF-κBluc (0.2 μg), and grown in the presence of increasing concentrations of NAC. 6 h prior harvest, cells were stimulated with 150 μm H2O2. Cells stimulated with 150 μm H2O2 for 6 h in the absence of NAC served as positive control (pos. Contr.), and unstimulated cells served as negative (neg.) control. Activities, shown as multiples of induction, are mean values from three independent experiments. The error bars represent the standard deviation. rel units, relative units. b, reporter gene assay of HepG2 cells cotransfected with pHBV1.2 (1.0 μg), pNQO1luc (0.2 μg), and pCDNA.3 (1.0 μg) to adjust the total DNA concentration. Cotransfection of pRafC4 (1.0 μg) was used to inhibit c-Raf, the small molecule inhibitors PD98095 for MEK, SB203580 for p38 MAPK, and calphostin C as a PKC inhibitor. Activities, shown as multiples of induction, are mean values from three independent experiments. The error bars represent the standard deviation. c, HepG2 cells were cotransfected with pHBV1.2 (0.4 μg), pHBx (0.4 μg), or pSVLMS (0.4 μg) and the luciferase reporter construct pγ-GCSluc (0.2 μg). The vector pCDNA.3 (0.8 μg) served as control and was set as 1. For inhibition of Nrf2 activity, ptdnNrf2 (0.4 μg) was cotransfected. In the other samples, the equal amount of pCDNA.3 (0.4 μg) was added to the transfection mixture. Activities, shown as multiples of induction, are mean values from three independent experiments. The error bars represent the standard deviation. d, HepG2 cells were cotransfected with pHBV1.2 (0.8 μg), pHBV1.2ΔHBx (0.8 μg), pHBV1.2Δ PreS2 (0.8 μg), or pHBV1.2ΔHBx/PreS2 (0.8 μg) and the luciferase reporter construct pNQO1luc (0.2 μg). The vector pCDNA.3 (0.8 μg) served as control and was set as 1. Activities, shown as multiples of induction, are mean values from three independent experiments. The error bars represent the standard deviation.
FIGURE 4.
FIGURE 4.
HBV expression is not affected by enhanced or reduced expression of ARE-regulated genes. HepAD38 were cotransfected with expression vectors encoding YFP-NQO1 or YFP-γ-GCS-fusion proteins. Cotransfection with YFP served as control. a, secretion of HBsAg and of HBeAg was quantified by ELISA. b, confocal laser scanning immunofluorescence microscopy (630-fold magnification). LHBs was detected by MA18/7 (red fluorescence) and YFP-NQO1 or YFP-γ-GCS (green fluorescence); nuclei were stained with DAPI. c, Western blot analysis of cellular lysates using an LHB-specific antiserum (MA18/7). Expression of the YFP-NQO1 or YFP-γ-GCS fusion proteins was demonstrated by NQO1- or γ-GCS-specific antibodies. d and e, HepAD38 cells were cotransfected with pcaNrf2 or ptdnNrf2. Transfection with pCDNA.3 served as control. The amount of secreted HBeAg (d) was determined by ELISA. The amount of secreted viral particles was quantified by real time PCR (e). f, primary mouse hepatocytes isolated from Nrf2−/− mice or from the corresponding WT mice were infected with AdHBV. The expression of HBV was quantified by HBsAg- and HBeAg-specific ELISA.
FIGURE 5.
FIGURE 5.
HBV-dependent induction of the ARE-regulated genes protects HBV-positive cells from oxidative damage. a, OxyBlot analysis of cellular lysates derived from HepG2 or HepAD38 cells. In case of the 5th and 6th lanes, cells were treated for 30 min with 2 mm H2O2 and in case of the 7th and 8th lanes for 4 h with 20 milliunits of glucose oxidase. Protein oxidation was analyzed using 2,4-dinitrophenylhydrazine (DNPH) (2nd, 4th, and 5th to 8th lanes) for covalent modification of oxidized proteins. 2,4-Dinitrophenylhydrazine was omitted in the 1st and 3rd lanes to demonstrate the specificity of the observed signals. b, OxyBlot analysis of cellular lysates derived from ptdnNrf2- or control plasmid-transfected HepAD38 cells treated for 30 min with 2 mm H2O2 in case of the 3rd and 4th lanes or for 4 h with 20 milliunits of glucose oxidase (5th and 6th lanes). c, 8-OHdG-specific ELISA of hydrolyzed chromosomal DNA isolated from untreated or H2O2-treated HepG2 or HepAD38. Stimulation with H2O2 was performed as described above (a and b).
FIGURE 6.
FIGURE 6.
Increased activity of the constitutive and decreased activity of the immunoproteasome in HBV-positive cell lines as compared with HepG2 cells. a, reporter gene assay of HepG2 cells cotransfected with pHBV1.2 (0.4 μg) and luciferase (luc) reporter constructs (0.2 μg) harboring different fragments of the promoter of the proteasomal subunit PSMB5 as follows: the complete promoter in case of 3.4-kb luciferase encompassing three XRE and two ARE sequences; the 1.1-kb fragment lacking the three XRE sequences but still harboring two ARE sequences; the 0.1-kb fragment that still harbors one ARE sequence; or the mutated 1.1-kb fragment harboring two mutated ARE sequences (p1.1PSMB5lucΔARE341/52). ptdnNrf2 (0.4 μg) was used to inhibit Nrf2 activity. pUC 18 (0.4 μg) was used as negative control and to adjust equal DNA amounts in all samples. Activities, shown as multiples of induction, are mean values from three independent experiments. The error bars represent the standard deviation. b, Western blot analyses of purified proteasomes from HepAD38, HepG2.2.15, and HepG2 cells using PSMB5- and PSMB5i (=LMP7)-specific antisera. Moreover PSMB1- and PSMB2-specific antisera were used. Detection of the α2 subunit served as loading control. c and d, analysis of constitutive (const.) (c) or immune (d) proteasomal activity (act.) by measuring the cleavage of the substrate peptides LLVY-AMC (c) or Cbz-VVRR-AMC (d). Proteasomes were isolated from HepG2 cells (control (contr.)) or from the HBV-positive cell lines HepG2.2.15 or HepAD38. Nrf2 was inhibited by coexpression of ptdnNrf2. MG132 was used to inhibit proteasomal activity. e, Western blot analyses (left panel) of proteasomes purified from pHBx, pSVLM-S-, pHBV1.2, or pCDNA.3-transfected HepG2 cells. For Western blotting PSMB5-, PSMB5i (=LMP7)-, HBx-, and PreS1/LHBs-specific antisera were used. Detection of the α2 subunit (upper panel) and of β-actin (lower panel) served as loading controls. Analysis of constitutive and immunoproteasomal activities was performed as above (right panel). f, proteasomal activities of HepG2 cell-derived proteasomes were determined in the presence of the indicated concentrations of HBx that was added to the reaction mixture. RLU, relative light units.
FIGURE 7.
FIGURE 7.
Decreased immunoproteasome activity in HBV-expressing cells is not fully rescued by interferon α or interferon γ. HepAD38, HepG2.2.15, and HepG2 cells were stimulated for 3 days with IFNα (a and c) or IFNγ (b and d) prior to isolation of the proteasomes. a and b, Western blot analyses of purified proteasomes using PSMB5i-specific antisera. Detection of the α2 subunit served as loading control. c and d, analysis of immunoproteasomal activity by measuring the cleavage of the substrate peptide Cbz-VVRR-AMC. e, Western blot analyses of proteasomes purified from pHBV1.2- or pCDNA.3-transfected HepG2 cells. Moreover, control transfected cells were stimulated by the addition of EGF (10 ng/ml) or insulin (50 nm) for 48 h. For Western blotting, PSMB5- and PSMB5i-specific antisera were used. Detection of the α2 subunit served as loading control. RLU, relative light units.

References

    1. Lupberger J., Hildt E. (2007) World J. Gastroenterol. 13, 74–81 - PMC - PubMed
    1. Beasley R. P., Hwang L. Y., Lin C. C., Chien C. S. (1981) Lancet 2, 1129–1133 - PubMed
    1. Benn J., Schneider R. J. (1994) Proc. Natl. Acad. Sci. U.S.A. 91, 10350–10354 - PMC - PubMed
    1. Hildt E., Munz B., Saher G., Reifenberg K., Hofschneider P. H. (2002) EMBO J. 21, 525–535 - PMC - PubMed
    1. Zhu H., Wang Y., Chen J., Cheng G., Xue J. (2004) Exp. Mol. Pathol. 76, 44–50 - PubMed

Publication types

MeSH terms