. 2010 Dec;30(24):5787-94.
doi: 10.1128/MCB.00347-10. Epub 2010 Oct 18.

Requirement of the ATM/p53 tumor suppressor pathway for glucose homeostasis

Affiliations

Requirement of the ATM/p53 tumor suppressor pathway for glucose homeostasis

Heather L Armata et al. Mol Cell Biol. 2010 Dec.

Abstract

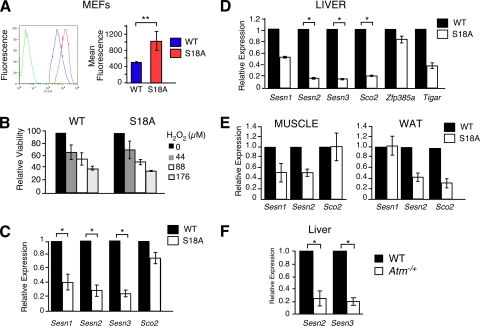
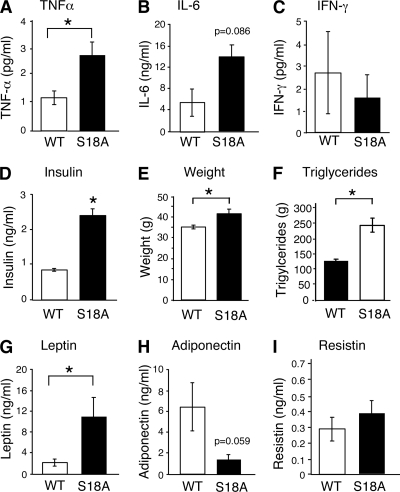
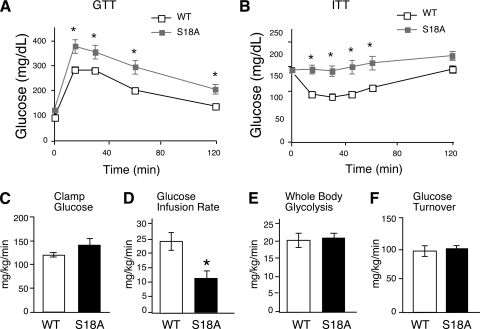
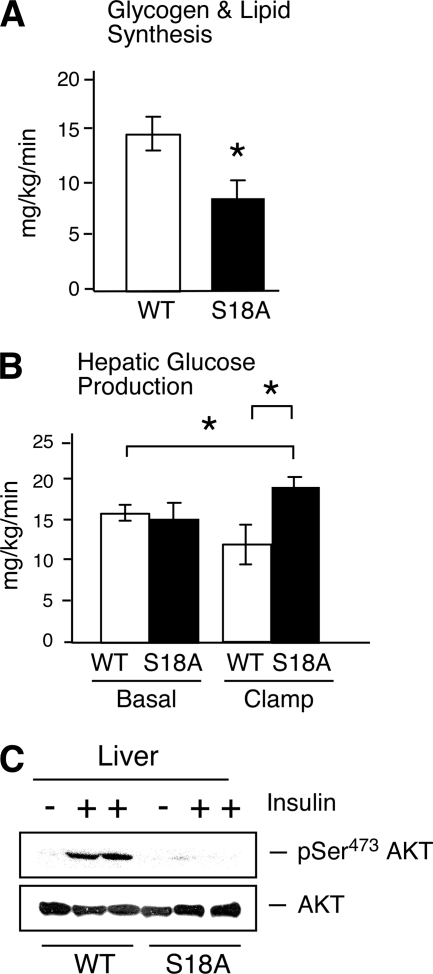
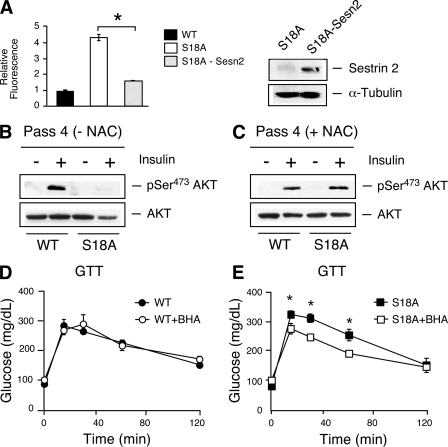
Ataxia telangiectasia (A-T) patients can develop multiple clinical pathologies, including neuronal degeneration, an elevated risk of cancer, telangiectasias, and growth retardation. Patients with A-T can also exhibit an increased risk of insulin resistance and type 2 diabetes. The ATM protein kinase, the product of the gene mutated in A-T patients (Atm), has been implicated in metabolic disease, which is characterized by insulin resistance and increased cholesterol and lipid levels, blood pressure, and atherosclerosis. ATM phosphorylates the p53 tumor suppressor on a site (Ser15) that regulates transcription activity. To test whether the ATM pathway that regulates insulin resistance is mediated by p53 phosphorylation, we examined insulin sensitivity in mice with a germ line mutation that replaces the p53 phosphorylation site with alanine. The loss of p53 Ser18 (murine Ser15) led to increased metabolic stress, including severe defects in glucose homeostasis. The mice developed glucose intolerance and insulin resistance. The insulin resistance correlated with the loss of antioxidant gene expression and decreased insulin signaling. N-Acetyl cysteine (NAC) treatment restored insulin signaling in late-passage primary fibroblasts. The addition of an antioxidant in the diet rendered the p53 Ser18-deficient mice glucose tolerant. This analysis demonstrates that p53 phosphorylation on an ATM site is an important mechanism in the physiological regulation of glucose homeostasis.


Figures

FIG. 1.
FIG. 1.
Regulation of antioxidant and metabolic genes by p53 Ser18. (A) The amount of reactive oxygen species (ROS) in MEFs was examined by DCF staining and analysis by flow cytometry. Left, representative relative fluorescence of non-DCF-stained cells (green line) and DCF-stained wild-type (WT) (blue line) and p53 S18A (red line) cells; right, quantification of fluorescence. Data are presented as means ± standard errors of the means (SEM; n = 5). (B) Viability of MEFs treated with hydrogen peroxide at the indicated doses and harvested 18 h posttreatment. Data are presented as means ± SEM (n = 5). (C to F) The expression of Sesn1, -2, and -3, Sco2, or Zfp385a, and Gapdh mRNA was measured by quantitative real-time PCR analysis of the MEFs, liver, white adipose tissue (WAT), and skeletal muscle of 6- to 7-month-old wild-type mice and compared to that of p53S18A mice (C to E) and Atm−/+ mice (F). The amount of Gapdh mRNA in each sample was used to calculate relative mRNA expression (means ± SEM; n = 3). Statistically significant differences between WT and p53S18A mice are indicated (*, P < 0.05).
FIG. 2.
FIG. 2.
Analysis of cytokines and metabolic parameters. Wild-type (WT) and p53S18A (S18A) mice were maintained on a standard chow diet. Experiments were performed on 6- to 7-month-old animals. (A to C) WT and p53S18A mice were fasted overnight, and the concentrations of TNF-α, IL-6, and IFN-γ in blood were measured (means ± SEM; n = 6 animals). (D) Insulin measurement in mice fasted overnight (means ± SEM; n = 9). (E) Body weight was measured at 6 months (means ± SEM; n = 15). (F) Concentration of triglyceride in the blood of WT and p53S18A mice was measured (means ± standard deviation [SD]; n = 3). (G to I) The concentrations of the adipokines leptin, adiponectin, and resistin in the blood of mice fasted overnight were measured (means ± SEM; n = 7). Statistically significant differences between WT and p53S18A mice are indicated (*, P < 0.05).
FIG. 3.
FIG. 3.
Insulin resistance in p53S18A mice. Wild-type (WT) and p53S18A (S18A) mice were maintained on a standard chow diet. Experiments were performed on 6- to 7-month-old animals. (A) Glucose tolerance test (GTT). Mice fasted overnight were treated with glucose (1 g/kg) by intraperitoneal injection. Blood glucose concentration was measured at the indicated times (means ± SEM; n = 15 to 20). (B) Insulin tolerance test (ITT). Mice fed ad libitum were treated with insulin (0.75 U/kg) by intraperitoneal injection. Blood glucose levels were measured at the indicated times (means ± SEM; n = 15 to 20). (C to F) Hyperinsulinemia-euglycemic clamp analysis (means ± SEM; n = 7 or 8). (C) Blood glucose concentration during the hyperinsulinemia-euglycemic clamp analysis; (D) steady-state glucose infusion rates to maintain euglycemia during the clamp; (E) whole-body glycolysis; (F) insulin-stimulated whole-body glucose turnover. Statistically significant differences are indicated (*, P < 0.05).
FIG. 4.
FIG. 4.
p53S18A mice exhibit hepatic insulin resistance. (A and B) Wild-type (WT) and p53S18A (S18A) mice were maintained on a standard chow diet. The data presented are the means ± SEM (n = 7 or 8). Statistically significant differences are indicated (*, P < 0.05). (A) Whole-body glycogen synthesis; (B) basal hepatic glucose production (HGP) (left) and insulin-stimulated HGP during the hyperinsulinemia-euglycemic clamp analysis (right). (C) Extracts prepared from the liver of WT and p53S18A mice were examined by immunoblot analysis using antibodies to Akt and pSer473 Akt. The mice were fasted overnight and treated without and with insulin (1.5 U/kg body mass) by intraperitoneal injection (30 min).
FIG. 5.
FIG. 5.
Role of increased ROS levels in metabolic defects in p53S18A mice. (A) Reduction of ROS levels by the expression of sestrin 2. Left, the amount of reactive oxygen species (ROS) in p53S18A MEFs was examined by DCF staining and analysis by flow cytometry and compared to that in wild-type cells. Data are presented as relative fluorescence (means ± SEM; n = 5). Right, Western analysis of the cells used in the experiment shown in the left panel, indicating expression of sestrin 2. (B and C) Insulin signaling is improved with NAC treatment. Passage 4 cells that were untreated (B) or treated with 0.5 mM NAC (C) were starved for 18 h and treated with 10 nM insulin. Akt and pSer473 Akt were examined by immunoblot. (D and E) Wild-type (WT) and p53S18A (S18A) mice were maintained on a standard chow diet or a diet including 1.5% BHA for approximately 4 weeks (at 6 months of age). Glucose tolerance test (GTT) on wild-type mice (D) and p53S18A mice (E). Mice fasted overnight were treated with glucose (1 g/kg) by intraperitoneal injection. The blood glucose concentration was measured at the indicated times (means ± SEM; n = 15 to 20). Statistically significant differences are indicated (*, P < 0.05).

Similar articles

Cited by

References

    1. Armata, H. L., D. S. Garlick, and H. K. Sluss. 2007. The ataxia telangiectasia-mutated target site Ser18 is required for p53-mediated tumor suppression. Cancer Res. 67:11696-11703. - PubMed
    1. Balaban, R. S., S. Nemoto, and T. Finkel. 2005. Mitochondria, oxidants, and aging. Cell 120:483-495. - PubMed
    1. Bar, R. S., W. R. Levis, M. M. Rechler, L. C. Harrison, C. Siebert, J. Podskalny, J. Roth, and M. Muggeo. 1978. Extreme insulin resistance in ataxia telangiectasia: defect in affinity of insulin receptors. N. Engl. J. Med. 298:1164-1171. - PubMed
    1. Barlow, C., P. A. Dennery, M. K. Shigenaga, M. A. Smith, J. D. Morrow, L. J. Roberts III, A. Wynshaw-Boris, and R. L. Levine. 1999. Loss of the ataxia-telangiectasia gene product causes oxidative damage in target organs. Proc. Natl. Acad. Sci. U. S. A. 96:9915-9919. - PMC - PubMed
    1. Barlow, C., S. Hirotsune, R. Paylor, M. Liyanage, M. Eckhaus, F. Collins, Y. Shiloh, J. N. Crawley, T. Ried, D. Tagle, and A. Wynshaw-Boris. 1996. Atm-deficient mice: a paradigm of ataxia telangiectasia. Cell 86:159-171. - PubMed

Publication types

MeSH terms