

Dasatinib sensitizes KRAS mutant colorectal tumors to cetuximab
- PMID: 20956938
- PMCID: PMC3025039
- DOI: 10.1038/onc.2010.430
Dasatinib sensitizes KRAS mutant colorectal tumors to cetuximab
Abstract
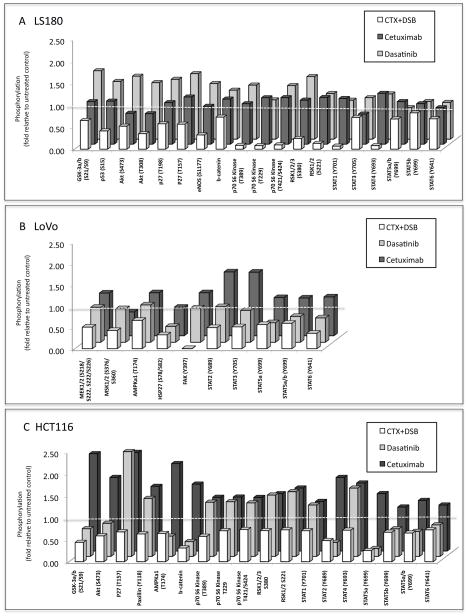
KRAS mutation is a predictive biomarker for resistance to cetuximab (Erbitux) in metastatic colorectal cancer (mCRC). This study sought to determine if KRAS mutant CRC lines could be sensitized to cetuximab using dasatinib (BMS-354825, Sprycel), a potent, orally bioavailable inhibitor of several tyrosine kinases, including the Src family kinases (SFKs). We analyzed 16 CRC lines for: (1) KRAS mutation status, (2) dependence on mutant KRAS signaling and (3) expression level of epidermal growth factor receptor (EGFR) and SFKs. From these analyses, we selected three KRAS mutant (LS180, LoVo and HCT116) cell lines and two KRAS wild-type cell lines (SW48 and CaCo2). In vitro, using poly-D-lysine/laminin plates, KRAS mutant cell lines were resistant to cetuximab, whereas KRAS wild-type lines showed sensitivity to cetuximab. Treatment with cetuximab and dasatinib showed a greater antiproliferative effect on KRAS mutant lines when compared with either agent alone in vitro and in vivo. To investigate potential mechanisms for this antiproliferative response in the combinatorial therapy, we performed Human Phospho-Kinase Antibody Array analysis, measuring the relative phosphorylation levels of 39 intracellular proteins in untreated, cetuximab, dasatinib or the combinatorial treatment in the KRAS mutant lines LS180, LoVo and HCT116 cells. The results of this experiment showed a decrease in a broad spectrum of kinases centered on the β-catenin pathway, the mitogen-activated protein kinase (MAPK) pathway, AKT/mammalian target of rapamycin (mTOR) pathway and the family of signal transducers and activators of transcription (STATs) when compared with the untreated control or monotherapy treatments. Next, we analyzed tumor growth with cetuximab, dasatinib or their combination in vivo. KRAS mutant xenografts showed resistance to cetuximab therapy, whereas KRAS wild type demonstrated an antitumor response when treated with cetuximab. KRAS mutant tumors exhibited minimal response to dasatinib monotherapy. However, as in vitro, KRAS mutant lines exhibited a response to the combination of cetuximab and dasatinib. Combinatorial treatment of KRAS mutant xenografts resulted in decreased cell proliferation, as measured by Ki67, and higher rates of apoptosis, as measured by TUNEL (terminal deoxynucleotidyl transferase-mediated dUTP nick end labeling). The data presented in this study indicate that dasatinib can sensitize KRAS mutant CRC tumors to cetuximab and may do so by altering the activity of several key signaling pathways. Furthermore, these results suggest that signaling via EGFR and SFKs may be necessary for cell proliferation and survival of KRAS mutant CRC tumors. These data strengthen the rationale for clinical trials combining cetuximab and dasatinib in the KRAS mutant CRC genetic setting.
Conflict of interest statement
DLW holds a sponsored research agreement with Bristol-Myer Squibb.
Figures


Comment in
-
Targeted therapies: dasatinib sensitizes KRAS-mutant colorectal cancer tumors to cetuximab.Nat Rev Clin Oncol. 2011 Mar 8;8(4):193. doi: 10.1038/nrclinonc.2011.24. Nat Rev Clin Oncol. 2011. PMID: 21451492 No abstract available.
-
KRAS mutant colorectal tumors: past and present.Small GTPases. 2012 Jan-Mar;3(1):34-9. doi: 10.4161/sgtp.18751. Small GTPases. 2012. PMID: 22714415 Free PMC article.
Similar articles
-
Effect of simvastatin on cetuximab resistance in human colorectal cancer with KRAS mutations.J Natl Cancer Inst. 2011 Apr 20;103(8):674-88. doi: 10.1093/jnci/djr070. Epub 2011 Mar 11. J Natl Cancer Inst. 2011. PMID: 21398618
-
Combine MEK inhibition with PI3K/mTOR inhibition exert inhibitory tumor growth effect on KRAS and PIK3CA mutation CRC xenografts due to reduced expression of VEGF and matrix metallopeptidase-9.Tumour Biol. 2015 Feb;36(2):1091-7. doi: 10.1007/s13277-014-2667-5. Epub 2014 Oct 19. Tumour Biol. 2015. PMID: 25326806
-
Broad RTK-targeted therapy overcomes molecular heterogeneity-driven resistance to cetuximab via vectored immunoprophylaxis in colorectal cancer.Cancer Lett. 2016 Nov 1;382(1):32-43. doi: 10.1016/j.canlet.2016.08.022. Epub 2016 Aug 26. Cancer Lett. 2016. PMID: 27569653
-
Recommendations from the EGAPP Working Group: can testing of tumor tissue for mutations in EGFR pathway downstream effector genes in patients with metastatic colorectal cancer improve health outcomes by guiding decisions regarding anti-EGFR therapy?Genet Med. 2013 Jul;15(7):517-27. doi: 10.1038/gim.2012.184. Epub 2013 Feb 21. Genet Med. 2013. PMID: 23429431
-
Cetuximab in the treatment of patients with colorectal cancer.Expert Opin Biol Ther. 2011 Jul;11(7):937-49. doi: 10.1517/14712598.2011.582464. Epub 2011 May 11. Expert Opin Biol Ther. 2011. PMID: 21557708 Review.
Cited by
-
Targeted therapies: dasatinib sensitizes KRAS-mutant colorectal cancer tumors to cetuximab.Nat Rev Clin Oncol. 2011 Mar 8;8(4):193. doi: 10.1038/nrclinonc.2011.24. Nat Rev Clin Oncol. 2011. PMID: 21451492 No abstract available.
-
c-Src and EGFR Inhibition in Molecular Cancer Therapy: What Else Can We Improve?Cancers (Basel). 2020 Jun 7;12(6):1489. doi: 10.3390/cancers12061489. Cancers (Basel). 2020. PMID: 32517369 Free PMC article. Review.
-
Primary and acquired resistance to EGFR-targeted therapies in colorectal cancer: impact on future treatment strategies.J Mol Med (Berl). 2014 Jul;92(7):709-22. doi: 10.1007/s00109-014-1161-2. Epub 2014 May 10. J Mol Med (Berl). 2014. PMID: 24811491 Free PMC article. Review.
-
Chemopreventive effect of the non-psychotropic phytocannabinoid cannabidiol on experimental colon cancer.J Mol Med (Berl). 2012 Aug;90(8):925-34. doi: 10.1007/s00109-011-0856-x. Epub 2012 Jan 10. J Mol Med (Berl). 2012. PMID: 22231745
-
Efficacy of combination chemotherapy using a novel oral chemotherapeutic agent, TAS-102, together with bevacizumab, cetuximab, or panitumumab on human colorectal cancer xenografts.Oncol Rep. 2015 May;33(5):2135-42. doi: 10.3892/or.2015.3876. Epub 2015 Mar 23. Oncol Rep. 2015. PMID: 25812794 Free PMC article.
References
-
- Abram CL, Courtneidge SA. Src family tyrosine kinases and growth factor signaling. Exp Cell Res. 2000;254:1–13. - PubMed
-
- Aligayer H, Boyd DD, Heiss MM, Abdalla EK, Curley SA, Gallick GE. Activation of Src kinase in primary colorectal carcinoma: an indicator of poor clinical prognosis. Cancer. 2002;94:344–51. - PubMed
-
- Allegra CJ, Jessup JM, Somerfield MR, Hamilton SR, Hammond EH, Hayes DF, et al. American Society of Clinical Oncology provisional clinical opinion: testing for KRAS gene mutations in patients with metastatic colorectal carcinoma to predict response to anti-epidermal growth factor receptor monoclonal antibody therapy. J Clin Oncol. 2009;27:2091–6. - PubMed
-
- Amado RG, Wolf M, Peeters M, Van Cutsem E, Siena S, Freeman DJ, et al. Wild-type KRAS is required for panitumumab efficacy in patients with metastatic colorectal cancer. J Clin Oncol. 2008;26:1626–34. - PubMed
-
- Bardelli A, Siena S. Molecular mechanisms of resistance to cetuximab and panitumumab in colorectal cancer. J Clin Oncol. 2010;28:1254–61. - PubMed
Publication types
MeSH terms
Substances
Grants and funding
LinkOut - more resources
Full Text Sources
Other Literature Sources
Medical
Research Materials
Miscellaneous
