

Ablation of the decorin gene enhances experimental hepatic fibrosis and impairs hepatic healing in mice
- PMID: 20956977
- PMCID: PMC5074558
- DOI: 10.1038/labinvest.2010.172
Ablation of the decorin gene enhances experimental hepatic fibrosis and impairs hepatic healing in mice
Abstract
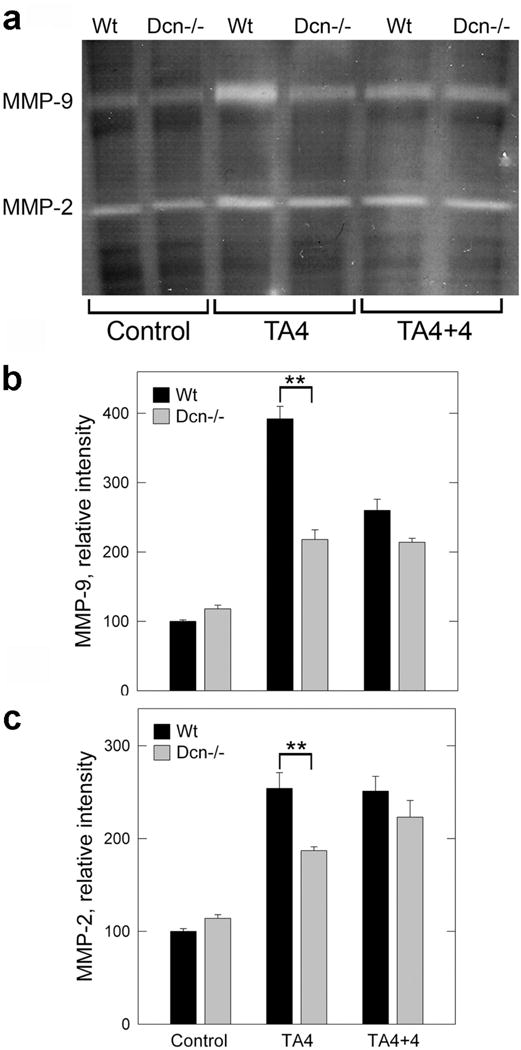
Accumulation of connective tissue is a typical feature of chronic liver diseases. Decorin, a small leucine-rich proteoglycan, regulates collagen fibrillogenesis during development, and by directly blocking the bioactivity of transforming growth factor-β1 (TGFβ1), it exerts a protective effect against fibrosis. However, no in vivo investigations on the role of decorin in liver have been performed before. In this study we used decorin-null (Dcn-/-) mice to establish the role of decorin in experimental liver fibrosis and repair. Not only the extent of experimentally induced liver fibrosis was more severe in Dcn-/- animals, but also the healing process was significantly delayed vis-à-vis wild-type mice. Collagen I, III, and IV mRNA levels in Dcn-/- livers were higher than those of wild-type livers only in the first 2 months, but no difference was observed after 4 months of fibrosis induction, suggesting that the elevation of these proteins reflects a specific impairment of their degradation. Gelatinase assays confirmed this hypothesis as we found decreased MMP-2 and MMP-9 activity and higher expression of TIMP-1 and PAI-1 mRNA in Dcn-/- livers. In contrast, at the end of the recovery phase increased production rather than impaired degradation was found to be responsible for the excessive connective tissue deposition in livers of Dcn-/- mice. Higher expression of TGFβ1-inducible early responsive gene in decorin-null livers indicated enhanced bioactivity of TGFβ1 known to upregulate TIMP-1 and PAI-1 as well. Moreover, two main axes of TGFβ1-evoked signaling pathways were affected by decorin deficiency, namely the Erk1/2 and Smad3 were activated in Dcn-/- samples, whereas no significant difference in phospho-Smad2 was observed between mice with different genotypes. Collectively, our results indicate that the lack of decorin favors the development of hepatic fibrosis and attenuates its subsequent healing process at least in part by affecting the bioactivity of TGFβ1.
Conflict of interest statement
DISCLOSURE/CONFLICT OF INTEREST The authors declare no conflict of interest.
Figures


Similar articles
-
Effect of Function-Enhanced Mesenchymal Stem Cells Infected With Decorin-Expressing Adenovirus on Hepatic Fibrosis.Stem Cells Transl Med. 2016 Sep;5(9):1247-56. doi: 10.5966/sctm.2015-0323. Epub 2016 Jun 30. Stem Cells Transl Med. 2016. PMID: 27365486 Free PMC article.
-
Smad2 protects against TGF-β1/Smad3-mediated collagen synthesis in human hepatic stellate cells during hepatic fibrosis.Mol Cell Biochem. 2015 Feb;400(1-2):17-28. doi: 10.1007/s11010-014-2258-1. Epub 2014 Oct 29. Mol Cell Biochem. 2015. PMID: 25351340
-
Insulin-like growth factor binding protein related protein 1 knockdown attenuates hepatic fibrosis via the regulation of MMPs/TIMPs in mice.Hepatobiliary Pancreat Dis Int. 2019 Feb;18(1):38-47. doi: 10.1016/j.hbpd.2018.08.008. Epub 2018 Aug 29. Hepatobiliary Pancreat Dis Int. 2019. PMID: 30243878
-
Decorin-TGFβ axis in hepatic fibrosis and cirrhosis.J Histochem Cytochem. 2012 Apr;60(4):262-8. doi: 10.1369/0022155412438104. Epub 2012 Jan 19. J Histochem Cytochem. 2012. PMID: 22260996 Free PMC article. Review.
-
Decorin the antifibrotic proteoglycan and its progression in therapy.Am J Physiol Cell Physiol. 2025 Jun 1;328(6):C1853-C1865. doi: 10.1152/ajpcell.01075.2024. Epub 2025 Apr 25. Am J Physiol Cell Physiol. 2025. PMID: 40279258 Review.
Cited by
-
Decorin interferes with platelet-derived growth factor receptor signaling in experimental hepatocarcinogenesis.FEBS J. 2013 May;280(10):2150-64. doi: 10.1111/febs.12215. Epub 2013 Mar 25. FEBS J. 2013. PMID: 23448253 Free PMC article.
-
Proteoglycans Are Attractive Biomarkers and Therapeutic Targets in Hepatocellular Carcinoma.Int J Mol Sci. 2018 Oct 8;19(10):3070. doi: 10.3390/ijms19103070. Int J Mol Sci. 2018. PMID: 30297672 Free PMC article. Review.
-
Tissue mechanics coevolves with fibrillar matrisomes in healthy and fibrotic tissues.Matrix Biol. 2022 Aug;111:153-188. doi: 10.1016/j.matbio.2022.06.006. Epub 2022 Jun 25. Matrix Biol. 2022. PMID: 35764212 Free PMC article. Review.
-
Elevated serum growth differentiation factor 15 and decorin predict the fibrotic progression of metabolic dysfunction-associated steatotic liver disease.Sci Rep. 2024 Nov 11;14(1):27527. doi: 10.1038/s41598-024-77719-6. Sci Rep. 2024. PMID: 39528512 Free PMC article.
-
Oncosuppressive functions of decorin.Mol Cell Oncol. 2015 Feb 25;2(3):e975645. doi: 10.4161/23723556.2014.975645. eCollection 2015 Jul-Sep. Mol Cell Oncol. 2015. PMID: 27308453 Free PMC article. Review.
References
-
- Hope TA, Herfkens RJ, Denianke KS, et al. Nephrogenic Systemic Fibrosis in Patients With Chronic Kidney Disease Who Received Gadopentetate Dimeglumine. Invest Radiol. 2009 - PubMed
-
- Zois CD, Baltayiannis GH, Karayiannis P, et al. Systematic review: hepatic fibrosis -regression with therapy. Aliment Pharmacol Ther. 2008;28:1175–1187. - PubMed
-
- Calvaruso V, Maimone S, Gatt A, et al. Coagulation and fibrosis in chronic liver disease. Gut. 2008;57:1722–1727. - PubMed
-
- Schnaper HW. Balance between matrix synthesis and degradation: a determinant of glomerulosclerosis. Pediatr Nephrol. 1995;9:104–111. - PubMed
-
- Balsano C, Alisi A, Nobili V. Liver fibrosis and therapeutic strategies: the goal for improving metabolism. Curr Drug Targets. 2009;10:505–512. - PubMed
Publication types
MeSH terms
Substances
Grants and funding
LinkOut - more resources
Full Text Sources
Medical
Molecular Biology Databases
Research Materials
Miscellaneous
