cDNA microarray gene expression profiling of hedgehog signaling pathway inhibition in human colon cancer cells
- PMID: 20957031
- PMCID: PMC2948497
- DOI: 10.1371/journal.pone.0013054
cDNA microarray gene expression profiling of hedgehog signaling pathway inhibition in human colon cancer cells
Abstract
Background: Hedgehog (HH) signaling plays a critical role in normal cellular processes, in normal mammalian gastrointestinal development and differentiation, and in oncogenesis and maintenance of the malignant phenotype in a variety of human cancers. Increasing evidence further implicates the involvement of HH signaling in oncogenesis and metastatic behavior of colon cancers. However, genomic approaches to elucidate the role of HH signaling in cancers in general are lacking, and data derived on HH signaling in colon cancer is extremely limited.
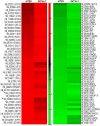
Methodology/principal findings: To identify unique downstream targets of the GLI genes, the transcriptional regulators of HH signaling, in the context of colon carcinoma, we employed a small molecule inhibitor of both GLI1 and GLI2, GANT61, in two human colon cancer cell lines, HT29 and GC3/c1. Cell cycle analysis demonstrated accumulation of GANT61-treated cells at the G1/S boundary. cDNA microarray gene expression profiling of 18,401 genes identified Differentially Expressed Genes (DEGs) both common and unique to HT29 and GC3/c1. Analyses using GenomeStudio (statistics), Matlab (heat map), Ingenuity (canonical pathway analysis), or by qRT-PCR, identified p21(Cip1) (CDKN1A) and p15(Ink4b) (CDKN2B), which play a role in the G1/S checkpoint, as up-regulated genes at the G1/S boundary. Genes that determine further cell cycle progression at G1/S including E2F2, CYCLIN E2 (CCNE2), CDC25A and CDK2, and genes that regulate passage of cells through G2/M (CYCLIN A2 [CCNA2], CDC25C, CYCLIN B2 [CCNB2], CDC20 and CDC2 [CDK1], were down-regulated. In addition, novel genes involved in stress response, DNA damage response, DNA replication and DNA repair were identified following inhibition of HH signaling.
Conclusions/significance: This study identifies genes that are involved in HH-dependent cellular proliferation in colon cancer cells, and following its inhibition, genes that regulate cell cycle progression and events downstream of the G1/S boundary.
Conflict of interest statement
Figures


Similar articles
-
The GLI genes as the molecular switch in disrupting Hedgehog signaling in colon cancer.Oncotarget. 2011 Aug;2(8):638-45. doi: 10.18632/oncotarget.310. Oncotarget. 2011. PMID: 21860067 Free PMC article.
-
Blocking Hedgehog survival signaling at the level of the GLI genes induces DNA damage and extensive cell death in human colon carcinoma cells.Cancer Res. 2011 Sep 1;71(17):5904-14. doi: 10.1158/0008-5472.CAN-10-4173. Epub 2011 Jul 11. Cancer Res. 2011. PMID: 21747117 Free PMC article.
-
Hedgehog signaling drives cellular survival in human colon carcinoma cells.Cancer Res. 2011 Feb 1;71(3):1092-102. doi: 10.1158/0008-5472.CAN-10-2315. Epub 2010 Dec 6. Cancer Res. 2011. PMID: 21135115 Free PMC article.
-
Hedgehog Signaling and Truncated GLI1 in Cancer.Cells. 2020 Sep 17;9(9):2114. doi: 10.3390/cells9092114. Cells. 2020. PMID: 32957513 Free PMC article. Review.
-
Targeting the Hedgehog signaling pathway in cancer: beyond Smoothened.Oncotarget. 2015 Jun 10;6(16):13899-913. doi: 10.18632/oncotarget.4224. Oncotarget. 2015. PMID: 26053182 Free PMC article. Review.
Cited by
-
GLI1: A Therapeutic Target for Cancer.Front Oncol. 2021 May 25;11:673154. doi: 10.3389/fonc.2021.673154. eCollection 2021. Front Oncol. 2021. PMID: 34113570 Free PMC article. Review.
-
Mode and specificity of binding of the small molecule GANT61 to GLI determines inhibition of GLI-DNA binding.Oncotarget. 2014 Jun 30;5(12):4492-503. doi: 10.18632/oncotarget.2046. Oncotarget. 2014. PMID: 24962990 Free PMC article.
-
Dietary fibre to reduce colon cancer risk in Alaska Native people: the Alaska FIRST randomised clinical trial protocol.BMJ Open. 2021 Aug 27;11(8):e047162. doi: 10.1136/bmjopen-2020-047162. BMJ Open. 2021. PMID: 34452959 Free PMC article.
-
TGFBR2 and BAX mononucleotide tract mutations, microsatellite instability, and prognosis in 1072 colorectal cancers.PLoS One. 2011;6(9):e25062. doi: 10.1371/journal.pone.0025062. Epub 2011 Sep 20. PLoS One. 2011. PMID: 21949851 Free PMC article.
-
In the war against solid tumors arsenic trioxide needs partners.J Gastrointest Cancer. 2014 Sep;45(3):363-71. doi: 10.1007/s12029-014-9617-8. J Gastrointest Cancer. 2014. PMID: 24825822 Review.
References
-
- Lum L, Beachy PA. The Hedgehog response network: sensors, switches, and routers. Science. 2004;304:1755–1759. - PubMed
-
- Hooper JE, Scott MP. Communicating with Hedgehogs. Nat Rev Mol Cell Biol. 2005;6:306–317. - PubMed
-
- Katoh Y, Katoh M. Hedgehog target genes: mechanisms of carcinogenesis induced by aberrant hedgehog signaling activation. Curr Mol Med. 2009;9:873–886. - PubMed
Publication types
MeSH terms
Substances
Grants and funding
LinkOut - more resources
Full Text Sources
Other Literature Sources
Research Materials
Miscellaneous

