

A rapid murine coma and behavior scale for quantitative assessment of murine cerebral malaria
- PMID: 20957049
- PMCID: PMC2948515
- DOI: 10.1371/journal.pone.0013124
A rapid murine coma and behavior scale for quantitative assessment of murine cerebral malaria
Abstract
Background: Cerebral malaria (CM) is a neurological syndrome that includes coma and seizures following malaria parasite infection. The pathophysiology is not fully understood and cannot be accounted for by infection alone: patients still succumb to CM, even if the underlying parasite infection has resolved. To that effect, there is no known adjuvant therapy for CM. Current murine CM (MCM) models do not allow for rapid clinical identification of affected animals following infection. An animal model that more closely mimics the clinical features of human CM would be helpful in elucidating potential mechanisms of disease pathogenesis and evaluating new adjuvant therapies.
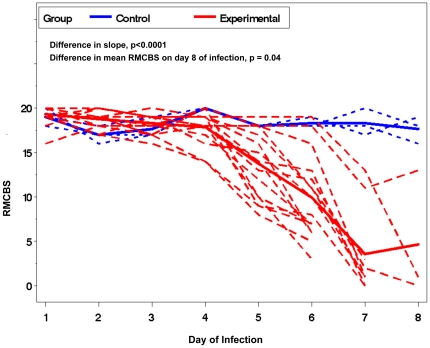
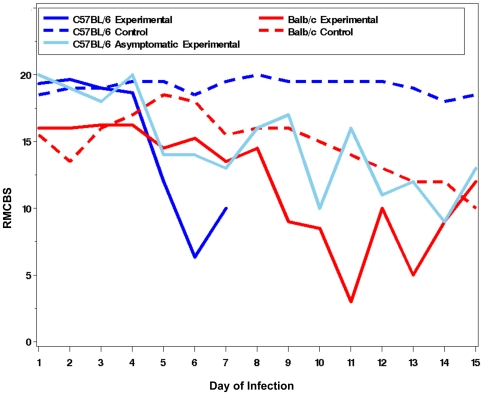
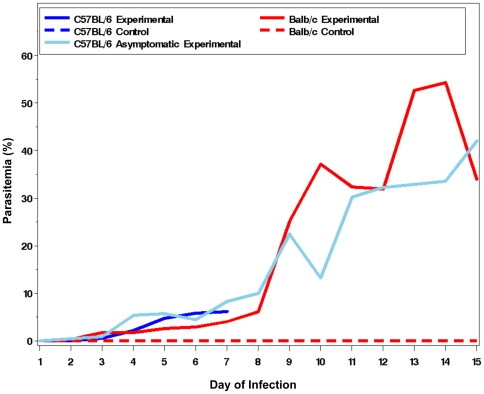
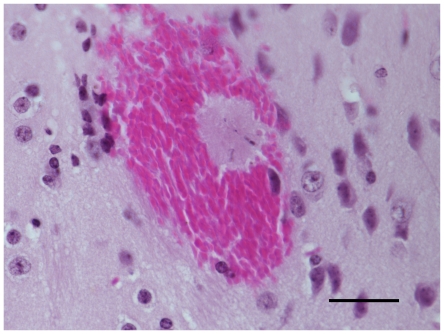
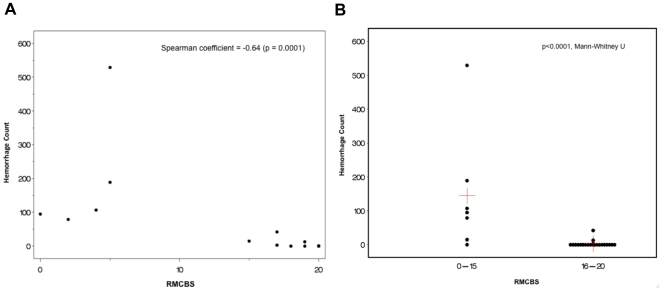
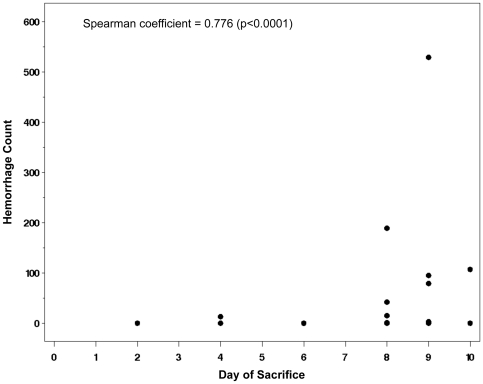
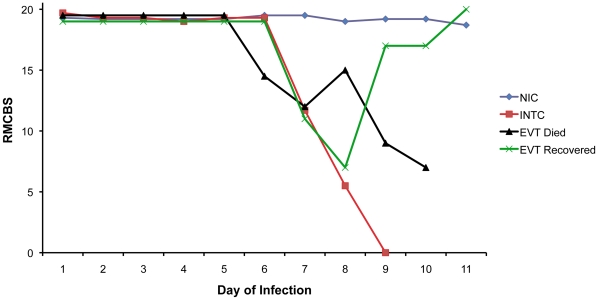
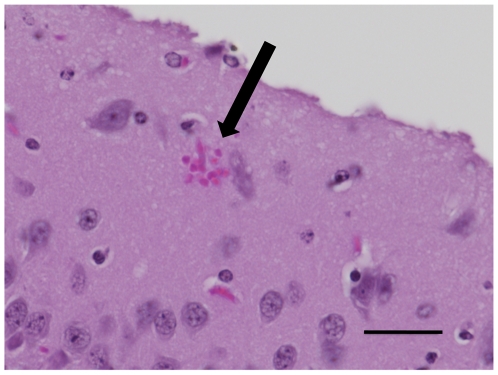
Methodology/principal findings: A quantitative, rapid murine coma and behavior scale (RMCBS) comprised of 10 parameters was developed to assess MCM manifested in C57BL/6 mice infected with Plasmodium berghei ANKA (PbA). Using this method a single mouse can be completely assessed within 3 minutes. The RMCBS enables the operator to follow the evolution of the clinical syndrome, validated here by correlations with intracerebral hemorrhages. It provides a tool by which subjects can be identified as symptomatic prior to the initiation of trial treatment.
Conclusions/significance: Since the RMCBS enables an operator to rapidly follow the course of disease, label a subject as affected or not, and correlate the level of illness with neuropathologic injury, it can ultimately be used to guide the initiation of treatment after the onset of cerebral disease (thus emulating the situation in the field). The RMCBS is a tool by which an adjuvant therapy can be objectively assessed.
Conflict of interest statement
Figures
Similar articles
-
Experimental Cerebral Malaria Spreads along the Rostral Migratory Stream.PLoS Pathog. 2016 Mar 10;12(3):e1005470. doi: 10.1371/journal.ppat.1005470. eCollection 2016 Mar. PLoS Pathog. 2016. PMID: 26964100 Free PMC article.
-
Cognitive dysfunction is sustained after rescue therapy in experimental cerebral malaria, and is reduced by additive antioxidant therapy.PLoS Pathog. 2010 Jun 24;6(6):e1000963. doi: 10.1371/journal.ppat.1000963. PLoS Pathog. 2010. PMID: 20585569 Free PMC article.
-
Long-term effect of uncomplicated Plasmodium berghei ANKA malaria on memory and anxiety-like behaviour in C57BL/6 mice.Parasit Vectors. 2018 Mar 20;11(1):191. doi: 10.1186/s13071-018-2778-8. Parasit Vectors. 2018. PMID: 29554958 Free PMC article.
-
Genetic analysis of cerebral malaria in the mouse model infected with Plasmodium berghei.Mamm Genome. 2018 Aug;29(7-8):488-506. doi: 10.1007/s00335-018-9752-9. Epub 2018 Jun 19. Mamm Genome. 2018. PMID: 29922917 Review.
-
Vascular dysfunction as a target for adjuvant therapy in cerebral malaria.Mem Inst Oswaldo Cruz. 2014 Aug;109(5):577-88. doi: 10.1590/0074-0276140061. Mem Inst Oswaldo Cruz. 2014. PMID: 25185000 Free PMC article. Review.
Cited by
-
Lung Damage Induced by Plasmodium berghei ANKA in Murine Model of Malarial Infection is Mitigated by Dietary Supplementation with DHA-Rich Omega-3.ACS Infect Dis. 2024 Oct 11;10(10):3607-3617. doi: 10.1021/acsinfecdis.4c00482. Epub 2024 Sep 20. ACS Infect Dis. 2024. PMID: 39303151 Free PMC article.
-
Dysregulation of angiopoietin-1 plays a mechanistic role in the pathogenesis of cerebral malaria.Sci Transl Med. 2016 Sep 28;8(358):358ra128. doi: 10.1126/scitranslmed.aaf6812. Sci Transl Med. 2016. PMID: 27683553 Free PMC article. Clinical Trial.
-
A Neuroprotective Effect of the Glutamate Receptor Antagonist MK801 on Long-Term Cognitive and Behavioral Outcomes Secondary to Experimental Cerebral Malaria.Mol Neurobiol. 2017 Nov;54(9):7063-7082. doi: 10.1007/s12035-016-0226-3. Epub 2016 Oct 28. Mol Neurobiol. 2017. PMID: 27796746
-
Neurofilament light chain plasma levels are associated with area of brain damage in experimental cerebral malaria.Sci Rep. 2022 Jun 24;12(1):10726. doi: 10.1038/s41598-022-14291-x. Sci Rep. 2022. PMID: 35750882 Free PMC article.
-
Further evidence for an anti-inflammatory role of artesunate in experimental cerebral malaria.Malar J. 2013 Nov 2;12:388. doi: 10.1186/1475-2875-12-388. Malar J. 2013. PMID: 24180288 Free PMC article.
References
-
- Breman JG. The ears of the hippopotamus: manifestations, determinants, and estimates of the malaria burden. Am J Trop Med Hyg. 2001;64:1–11. - PubMed
-
- Severe falciparum malaria. World Health Organization, Communicable Diseases Cluster. Trans R Soc Trop Med Hyg. 2000;94(Suppl 1):S1–90. - PubMed
-
- Kihara M, Carter JA, Newton CR. The effect of Plasmodium falciparum on cognition: a systematic review. Trop Med Int Health. 2006;11:386–397. - PubMed
Publication types
MeSH terms
Grants and funding
LinkOut - more resources
Full Text Sources
Medical
