Review
. 2010 Sep 20;11(9):3397-412.
doi: 10.3390/ijms11093397.

Practical application of toxicogenomics for profiling toxicant-induced biological perturbations

Affiliations
Review

Practical application of toxicogenomics for profiling toxicant-induced biological perturbations

Naoki Kiyosawa et al. Int J Mol Sci. .

Abstract

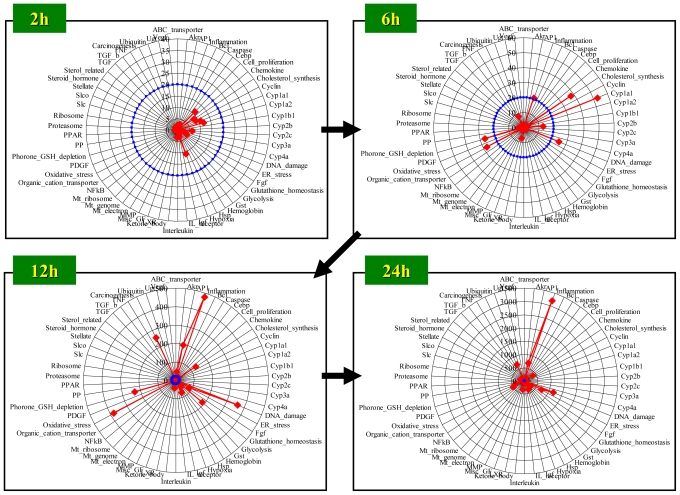
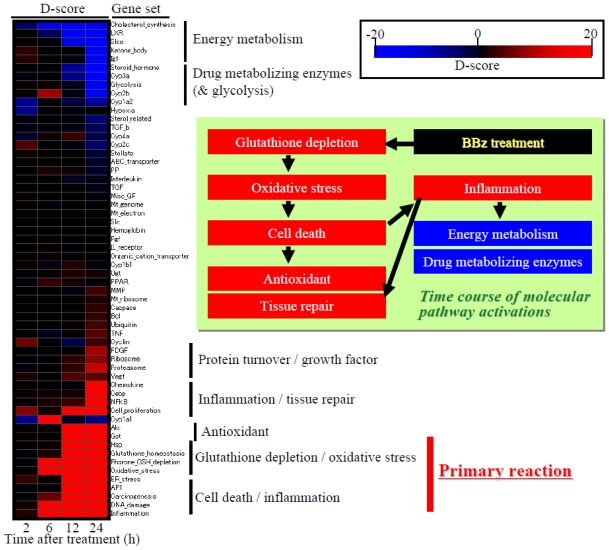
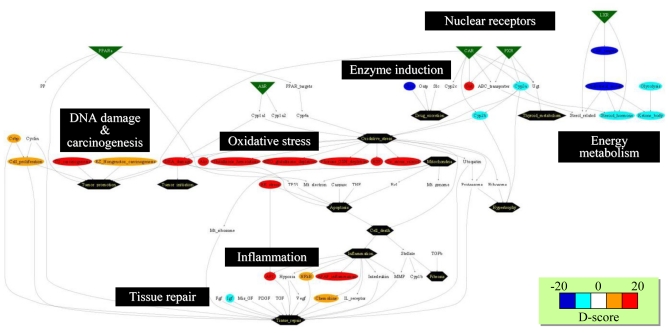
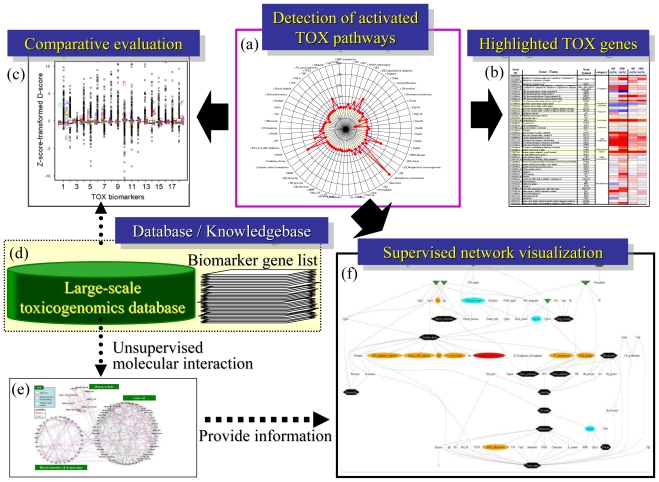
A systems-level understanding of molecular perturbations is crucial for evaluating chemical-induced toxicity risks appropriately, and for this purpose comprehensive gene expression analysis or toxicogenomics investigation is highly advantageous. The recent accumulation of toxicity-associated gene sets (toxicogenomic biomarkers), enrichment in public or commercial large-scale microarray database and availability of open-source software resources facilitate our utilization of the toxicogenomic data. However, toxicologists, who are usually not experts in computational sciences, tend to be overwhelmed by the gigantic amount of data. In this paper we present practical applications of toxicogenomics by utilizing biomarker gene sets and a simple scoring method by which overall gene set-level expression changes can be evaluated efficiently. Results from the gene set-level analysis are not only an easy interpretation of toxicological significance compared with individual gene-level profiling, but also are thought to be suitable for cross-platform or cross-institutional toxicogenomics data analysis. Enrichment in toxicogenomics databases, refinements of biomarker gene sets and scoring algorithms and the development of user-friendly integrative software will lead to better evaluation of toxicant-elicited biological perturbations.

Keywords: bioinformatics; biomarker; microarray; systems biology; toxicogenomics.


Figures

Figure 1
Figure 1
Expression profiling for toxicogenomic biomarker gene sets. Gene sets whose expression levels are closely associated with cell proliferation, glutathione metabolism and inflammatory responses are presented. The heat map represents gene expression changes, where up-regulation, no change and down-regulation are colored in red, white and blue, respectively.
Figure 2
Figure 2
Scoring multiple toxicological endpoints using toxicogenomics data. Multiple toxicological endpoint-associated gene sets or TGx biomarkers need to be prepared in advance, and the overall expression changing levels for each gene set are calculated by certain algorithms such as the D-score, by which affected levels for each biological pathway can be evaluated intuitively.
Figure 3
Figure 3
Detection of affected toxicological endpoints by D-score. (A) Rats were treated with prototypical hepatotoxicants acetaminophen (APAP), phenobarbital (PB), clofibrate (CFB) or acetamidofluorene (AAF), and the hepatic microarray data were obtained at 3, 6, 9 and 24 h after treatment. The D-score highlights the activated toxicological endpoints elicited by the chemicals: glutathione depletion and inflammation by APAP, Cyp2b/Cyp3a induction by PB, PPARα activation by CFB and Cyp1 induction by AAF; (B) All the D-scores except for that of Cyp2b exhibited a clear dose-response. Data are reprinted from [31] with permission from Elsevier.
Figure 4
Figure 4
Gene set- and phenotype-level network analysis. A large-scale TGx database, TG-GATE, was used for extracting statistically significant relationships among gene sets and phenotypes by utilizing a GGM algorithm. The network consists of D-scores for 58 gene sets, as well as changing levels of phenotype data such as organ weight, blood chemistry and hematology. Purple and green represent positive and negative partial correlation coefficients, respectively, and the width of the lines represents strength of the correlation measured with partial correlation coefficient. The network was drawn with open-source software Cytoscape.
Figure 5
Figure 5
Time course of D-score: Radar chart presentation. D-scores were calculated for rat livers harvested at 2, 6, 12 and 24 h after bromobenzene treatment, and are presented in a radar chart. The red line indicates the D-score for each gene set, and the blue circle indicates a D-score = 20 for each gene set. Detailed information for the gene sets used can be obtained in a previous report [42].
Figure 6
Figure 6
Time course of D-score: Heat map presentation. Red and blue indicate high and low D-scores, or up- and down-regulation for each gene set, respectively. The heat map indicates that the first trigger invoked by bromobenzene exposure was glutathione depletion and associated oxidative stress responses, followed by cell death, inflammation and up-regulation of antioxidant factors, as well as down-regulation of energy metabolism and drug metabolizing enzymes.
Figure 7
Figure 7
Network structure presentation of D-scores. Biological and toxicological relationships among gene sets were visualized as a supervised network using GraphViz software. The D-scores calculated for microarray data on rat livers at 24 h after bromobenzene treatment are presented in a network structure using GraphViz software, where red and blue indicate high and low D-scores, respectively. The network demonstrates oxidative stress and DNA damage were induced by bromobenzene treatment, while sterol metabolism was down-regulated.
Figure 8
Figure 8
Analytical flow for toxicity evaluation using TGx data. (A) Radar chart for D-scores using 58 gene sets; (B) Box plot for comparative analysis using a reference TGx database; (C) Heat map for individual genes; (D) TGx reference database and TGx biomarker knowledgebase; (E) Unsupervised gene set-level network inference to extract toxicological relationships among pathways; (F) Supervised gene set-level network.

References

    1. Kaplowitz N. Idiosyncratic drug hepatotoxicity. Nat. Rev. Drug Discov. 2005;4:489–499. - PubMed
    1. Marchetti S, Mazzanti R, Beijnen JH, Schellens JH. Concise review: Clinical relevance of drug drug and herb drug interactions mediated by the ABC transporter ABCB1 (MDR1, P-glycoprotein) Oncologist. 2007;12:927–941. - PubMed
    1. Haddad A, Davis M, Lagman R. The pharmacological importance of cytochrome CYP3A4 in the palliation of symptoms: Review and recommendations for avoiding adverse drug interactions. Support. Care Cancer. 2007;15:251–257. - PubMed
    1. Kodama S, Negishi M. Phenobarbital confers its diverse effects by activating the orphan nuclear receptor car. Drug Metab. Rev. 2006;38:75–87. - PubMed
    1. Kitano H. Towards a theory of biological robustness. Mol. Syst. Biol. 2007;3:137. - PMC - PubMed

MeSH terms

LinkOut - more resources