. 2010 Sep 23;6(9):e1000938.
doi: 10.1371/journal.pcbi.1000938.

Drug off-target effects predicted using structural analysis in the context of a metabolic network model

Affiliations

Drug off-target effects predicted using structural analysis in the context of a metabolic network model

Roger L Chang et al. PLoS Comput Biol. .

Abstract

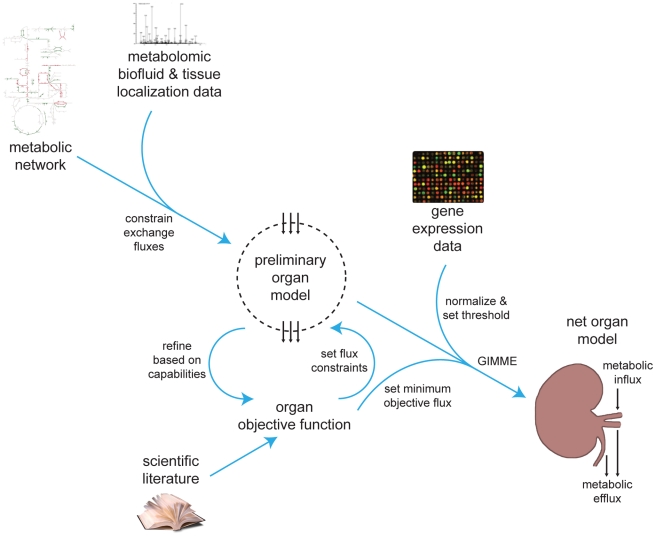
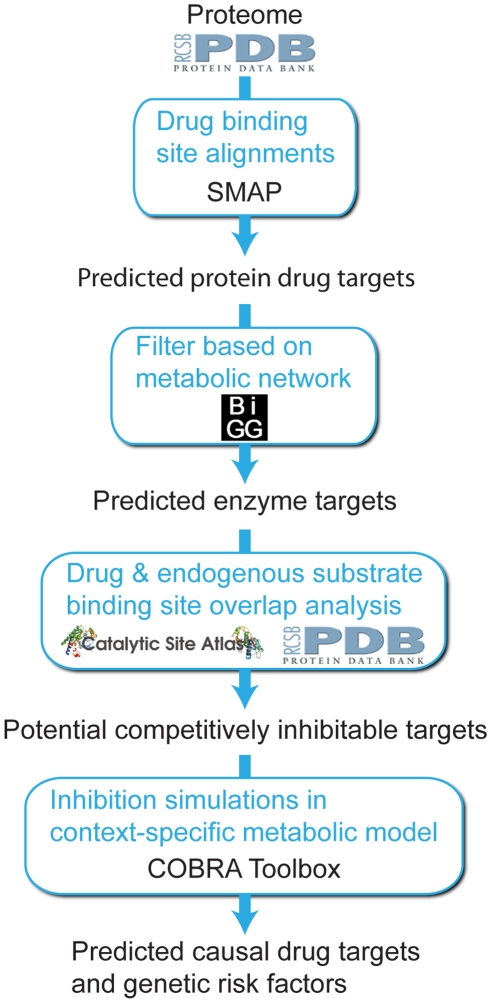
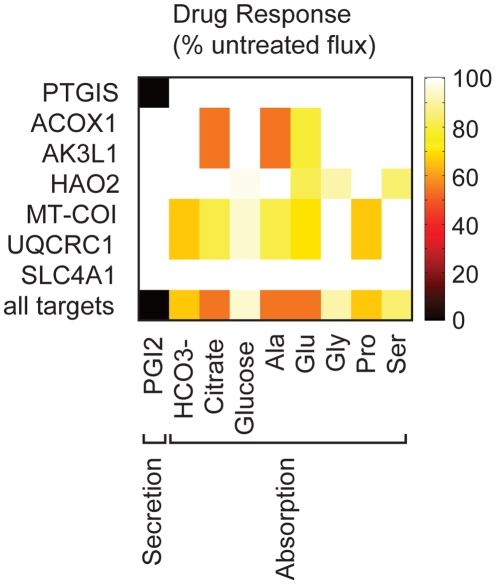
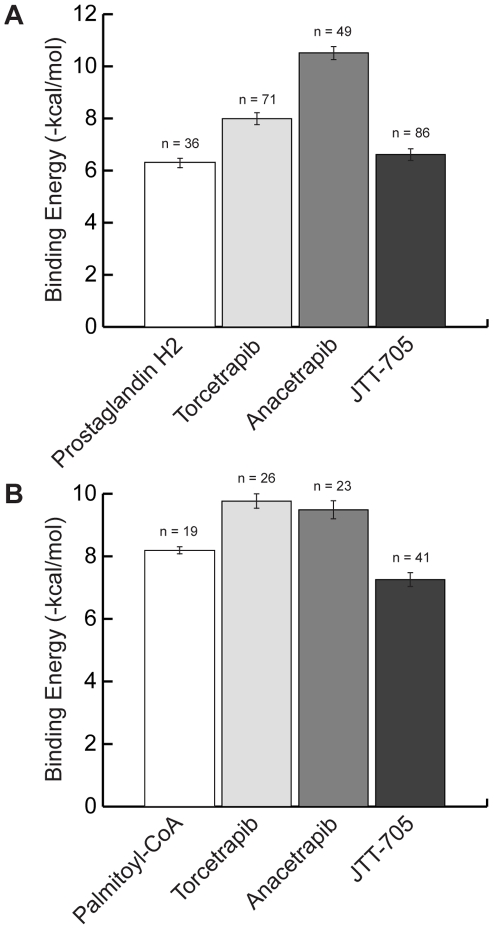
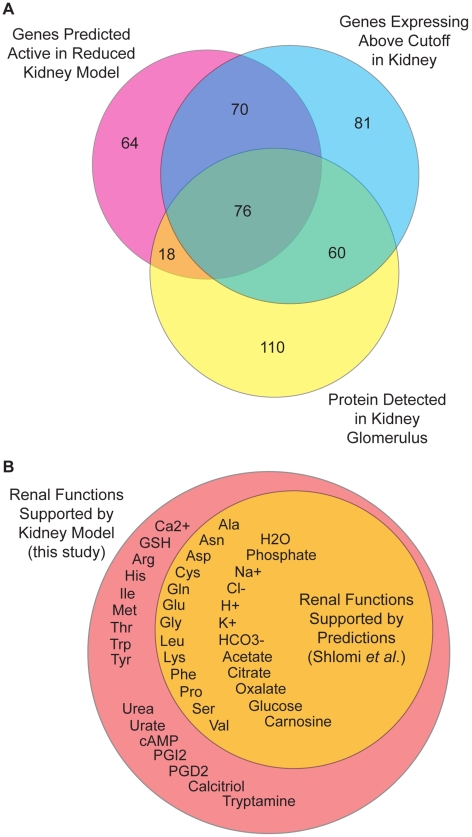
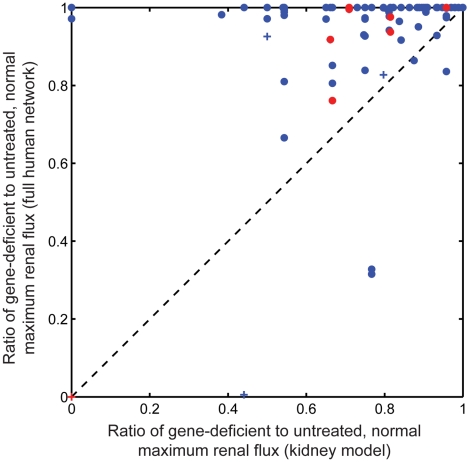
Recent advances in structural bioinformatics have enabled the prediction of protein-drug off-targets based on their ligand binding sites. Concurrent developments in systems biology allow for prediction of the functional effects of system perturbations using large-scale network models. Integration of these two capabilities provides a framework for evaluating metabolic drug response phenotypes in silico. This combined approach was applied to investigate the hypertensive side effect of the cholesteryl ester transfer protein inhibitor torcetrapib in the context of human renal function. A metabolic kidney model was generated in which to simulate drug treatment. Causal drug off-targets were predicted that have previously been observed to impact renal function in gene-deficient patients and may play a role in the adverse side effects observed in clinical trials. Genetic risk factors for drug treatment were also predicted that correspond to both characterized and unknown renal metabolic disorders as well as cryptic genetic deficiencies that are not expected to exhibit a renal disorder phenotype except under drug treatment. This study represents a novel integration of structural and systems biology and a first step towards computational systems medicine. The methodology introduced herein has important implications for drug development and personalized medicine.


Conflict of interest statement

A patent application has been filed for the modeling and simulation approach used in this study for predicting drug responses, metabolic disorders, and risk factors for treatment.

Figures

Figure 1
Figure 1. Context-specific organ metabolic modeling.
Preliminary constraints were imposed upon metabolite exchange fluxes of the full metabolic network based on coordinated experimental detection of transportable metabolites both in the organ tissue and the biofluids processed by the organ. Metabolites detected in both biofluid and organ were assumed freely exchangeable in the model, and the remainder of the metabolite exchanges were tentatively constrained to zero. Organ physiology literature was reviewed to compile an objective function consisting of the metabolic functions of the organ. Each function was tested for compatibility with the preliminary model. Metabolite exchange, transport, and demand reactions required to achieve some functions were added to the network, and exchange fluxes for objective metabolites were directionally constrained in accordance with the literature. Functions not compatible with the model were removed from the overall objective function. The objective function was then integrated with gene expression data obtained from an organ tissue sample to derive a net, context-specific metabolic organ model representing the metabolic exchange between the organ and the rest of the body and the metabolic reactions that take place within the organ to achieve this exchange.
Figure 2
Figure 2. Summary of gene activity predictions in the full kidney model.
The pie chart at bottom represents the Recon1 gene activity predictions resulting from deriving the kidney model. Genes predicted inactive are those genes with no associated active reaction fluxes in the kidney model. Genes for which no activity prediction was made are those associated with active reaction fluxes in the kidney model but either are not represented in the gene expression data or were not determined as the gene whose expression level is most limiting for any associated reaction through evaluation of GPR Boolean rules with respect to gene expression data. The slice at top represents genes predicted active in the kidney model.
Figure 3
Figure 3. Reduced kidney model subsystem distribution.
The distribution of metabolic reactions predicted to be active in the reduced kidney model with respect to broad metabolic subsystem categories is shown. The distribution excludes objective function, exchange, and demand reactions used to perform simulations in the model.
Figure 4
Figure 4. Identifying causal genes for drug response phenotypes and metabolic disorders.
First, the human proteome was screened to identify off-target drug-binding sites. The resulting list of putative off-targets was filtered to focus on just metabolic proteins. Then, for each predicted metabolic off-target, the endogenous functional sites were compared to the predicted drug-binding site to identify overlap. Off-target proteins for which overlapping binding sites were identified were considered to be competitively inhibitable by the drug at the overlapping endogenous functional sites. The functional consequences of such inhibitions were then tested in an appropriate context-specific metabolic model. All possible individual gene knockouts were also simulated to predict genetic disorders that lead to functional deficiencies either alone or in combination with drug treatment. Those off-targets whose inhibition impacted model function represent causal off-targets predicted to be associated with the drug response phenotype, and the gene knockouts that impacted model function represent genetic risk factors for metabolic disorders, which may lead to amplification of the drug response phenotype.
Figure 5
Figure 5. CETP inhibitor renal response phenotypes.
Elements of the color matrix represent the percent of the maximum normal, untreated renal objective flux achievable by the CETP-inhibitor-treated normal kidney model. The x-axis corresponds to individual renal objective functions, and the y-axis corresponds to the predicted drug off-targets. Metabolite abbreviations are defined in Table 1. Only the subset of renal objective functions for which a drug response phenotype was predicted is displayed.
Figure 6
Figure 6. Differential causal off-target ligand and drug binding affinities.
(A) Binding affinities of the prostaglandin I2 (prostacyclin) synthase protein for CETP inhibitors and prostaglandin H2, the endogenous substrate. (B) Binding affinities of the acyl-Coenzyme A oxidase 1, palmitoyl protein for CETP inhibitors and palmitoyl-CoA, the endogenous substrate. Each bar shows the mean binding energy predicted from docking trials. The standard error is indicated for each bar along with the number of predicted binding poses.
Figure 7
Figure 7. Comparative reduced kidney model evaluation.
(A) Overlap of gene activity predictions with genes expressing above the significance threshold. Regions of the diagram are approximately proportional to their associated set sizes. The magenta circle represents the set of genes predicted active in the reduced kidney model. The cyan circle represents the set of Recon1-associated genes with expression levels above the significance threshold in the kidney tissue data. The yellow circle represents the set of genes encoding proteins that were detected in normal human kidney glomerulus tissue. (B) Renal metabolic objectives supported by predicted reaction flux states. The orange circle represents renal metabolic objectives supported both by the kidney model developed in this study and a kidney model derived from the reaction activity predictions of Shlomi et al. The red circle represents renal metabolic objectives supported only by the kidney model from this study. Metabolite abbreviations are defined in Table 1.
Figure 8
Figure 8. Predictive ability gained by modeling.
The dotted black line is the line y = x for ease of visual comparison. Red marks represent predictions resulting from inhibition of a predicted CETP inhibitor off-target. Blue marks represent predictions resulting from non-drug-target gene inhibition. Pluses represent predictions validated in the OMIM database. There are 608 marks in total plotted and exact and partial overlap of some marks precludes complete visual resolution.

References

    1. Hellerstein MK. Exploiting complexity and the robustness of network architecture for drug discovery. J Pharmacol Exp Ther. 2008;325:1–9. - PubMed
    1. Searls DB. Data integration: challenges for drug discovery. Nat Rev Drug Discov. 2005;4:45–58. - PubMed
    1. Xie L, Bourne PE. Detecting evolutionary relationships across existing fold space, using sequence order-independent profile-profile alignments. Proc Natl Acad Sci U S A. 2008;105:5441–5446. - PMC - PubMed
    1. Xie L, Li J, Xie L, Bourne PE. Drug discovery using chemical systems biology: identification of the protein-ligand binding network to explain the side effects of CETP inhibitors. PLoS Comput Biol. 2009;5:e1000387. - PMC - PubMed
    1. Paolini GV, Shapland RH, van Hoorn WP, Mason JS, Hopkins AL. Global mapping of pharmacological space. Nat Biotechnol. 2006;24:805–815. - PubMed

Publication types

MeSH terms