. 2010 Nov;2(11-12):669-79.
doi: 10.1039/c0ib00038h. Epub 2010 Oct 19.

A neuron-benign microfluidic gradient generator for studying the response of mammalian neurons towards axon guidance factors

Affiliations

A neuron-benign microfluidic gradient generator for studying the response of mammalian neurons towards axon guidance factors

Nirveek Bhattacharjee et al. Integr Biol (Camb). 2010 Nov.

Abstract

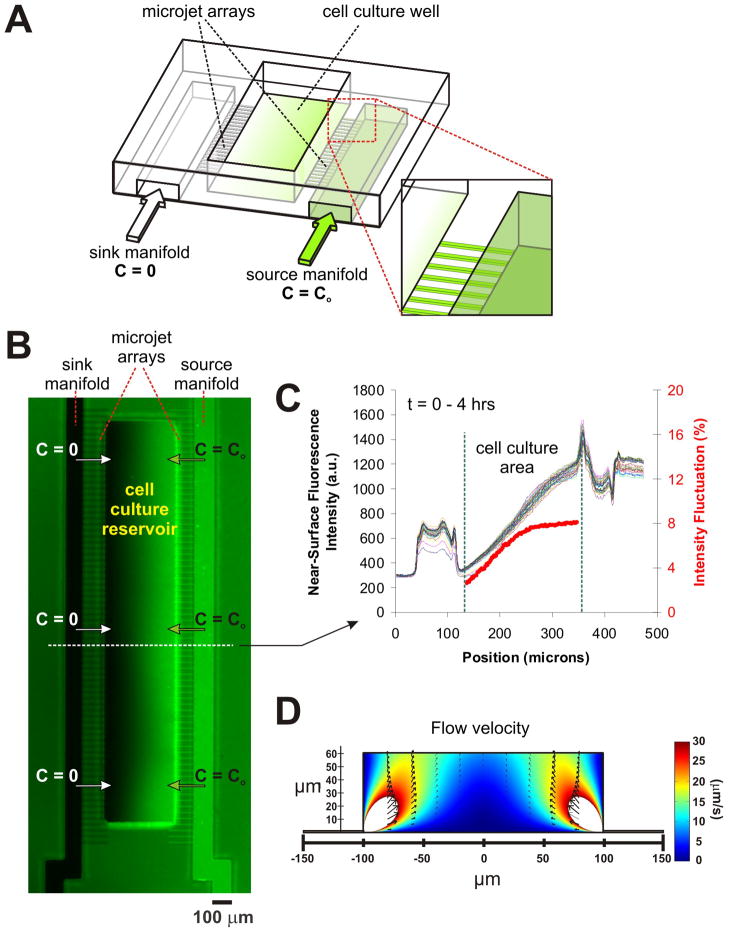
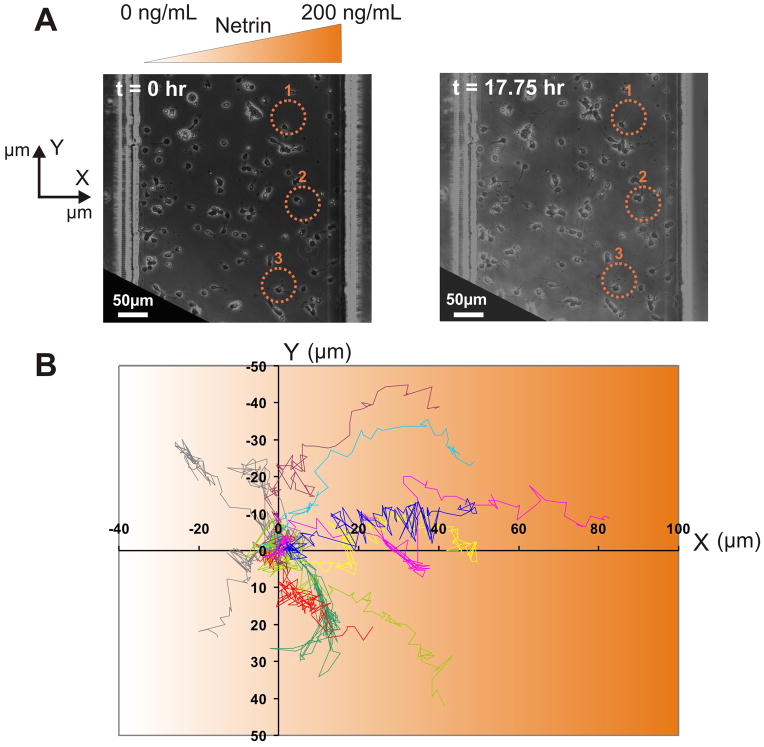
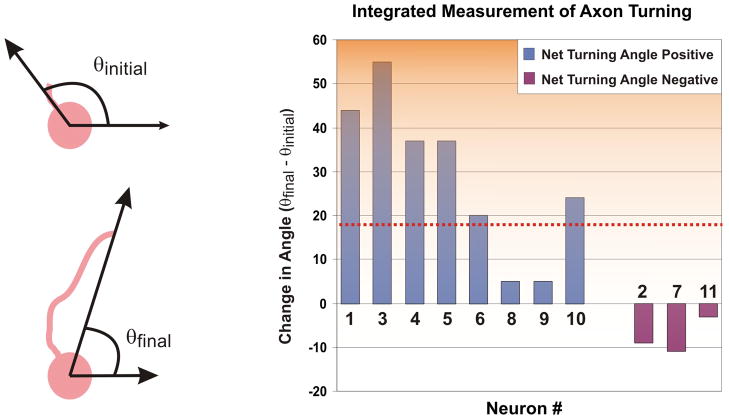
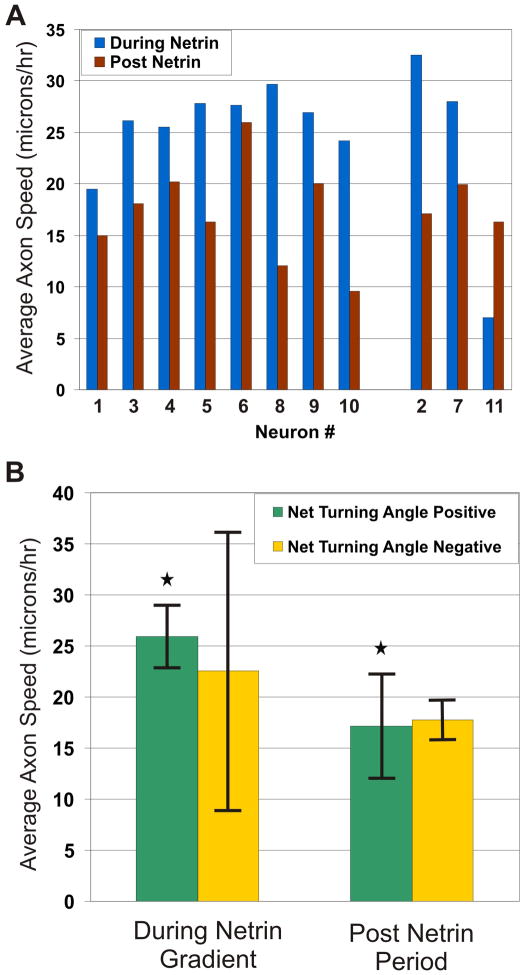
Investigation of biochemical cues in isolation or in combinations in cell culture systems is crucial for unraveling the mechanisms that govern neural development and repair. The most widely used experimental paradigms that elicit axon guidance in vitro utilize as the source of the gradient a pulsatile pipette, transfected cells, or a loaded gel, producing time-varying gradients of poor reproducibility which are not well suited for studying slow-growing mammalian cells. Although microfluidic device design have allowed for generating stable, complex gradients of diffusible molecules, the flow-induced shear forces in a microchannel has made it impossible to maintain viable mammalian neuronal cultures for sufficiently long times. In this paper, we describe axonal responses of mouse cortical neurons in a "neuron-benign" gradient-generator device based on an open chamber that can establish highly stable gradients of diffusible molecules for at least 6 h with negligible shear stress, and also allows the neurons to thrive for at least 2 weeks. Except for the period when the gradient is on, the cells in the gradient are under the same conditions as the cells on the control surfaces, which ensure a consistent set of micro-environmental variables. The gradient stability and uniformity over the cell culture surface achieved by the device, together with our software platform for acquiring, post-processing and quantitatively analyzing the large number of images allowed us to extract valuable information even from small datasets. We report a directed response of primary mammalian neurons (from E14 embryonic mice cortex) to a diffusible gradient of netrin in vitro. We infer from our studies that a large majority (∼73%) of the neurons that extend axons during the gradient application grow towards the netrin source, and our data analysis also indicates that netrin acts as a growth factor for this same population of neurons.


Figures

Fig. 1
Fig. 1
The Micro-jets Device: (A) Schematic of the device depicting a central open-surface reservoir (200 μm-wide, 66 μm-deep) that is fed laterally by two microchannels termed “sink manifold” and “source manifold” (each 100 μm-wide), which eject material into the reservoir through an array of small orifices called “micro-jets” (each approx. 10 μm × 2.5 μm cross section); (B) Pseudo-color image showing a representative, 4 hr-long surface gradient profile of fluorescein after the micro-jets are pressurized. The right microchannel (“source manifold”) was filled with 45 mM Orange-G and 1 mM fluorescein, while the left microchannel (“sink manifold”) and the cell culture reservoir were initially filled with 45 mM Orange-G only. (C) Line-scan measurements of fluorescence intensity across the device over time at the 10 pixel-wide line drawn in (A). The red line depicts the intensity fluctuations (defined as the standard deviation of all the fluorescence values over time observed for any given position of the channel relative to the time-average fluorescence at that position; the first four time points were not included for averaging because the gradient was still not in steady state). As shown, the gradient remained stable (within 3–8%) for 4 hours. (D) Fluid dynamic simulations plotting the flow velocities in a 60 μm high, 200 μm wide cell-culture reservoir. The arrows show that the flow is mostly directed upwards towards the air-fluid interface.
Fig. 2
Fig. 2
Neuronal Response to Netrin: (A) Bright-field image of neurons in the device at the beginning and at the end of the experimental time-period (17.75 hrs). Netrin (0 to 200 ng over a span of 500 μm) was applied for the first 6 hours. Scale bar = 50 μm. (B) Overlay of axon trajectories (normalized to the initial tip positions) from 11 neurons (E14, 1 DIV) during 17.75 hours in one experiment, showing that axons grew towards the netrin gradient.
Fig. 3
Fig. 3
Angular Difference of Axon Tip between End-Points: Bar graphs plotting the change in the angle of the axon tip (as measured from the centroid of the cell body, with respect to the gradient direction along the positive y-axis) between the end-points of the experiment. The neurons are grouped according to whether they had a net positive (left 8 “blue” bars) or negative (right 3 “purple” bars) turning angle. The red dotted line represents the mean (18.7°) angle (p < 0.05 using Student’s t-test).
Fig. 4
Fig. 4
Netrin as a Growth Factor: (A) Bar graph plotting the average speed of all the individual axons during netrin gradient application (blue) and after the removal of the gradient (red). The neurons are grouped into ones that had a net positive turning angle (left 8 bars) and ones that had a net negative turning angle (right 3 bars), as determined from Fig. 3 (B) Bar graphs plotting the average normalized speed of the axon tips (magnitude of the axon growth velocity vector) during netrin gradient application, after removal of the gradient, plotted separately for the axons that turned in the direction of the gradient (green, n = 8) and the ones that turned away from it (yellow, n = 3). Error bars in the graph correspond to one standard error above and below the average. * = p-value < 0.05, using non-parametric paired, two-sided, signed-rank Wilcoxon test.
Fig. 5
Fig. 5
Axonal Responses in the Direction of the Gradient Source: (A) Plot of the accessibility coefficient (defined as the ratio of the angular spread of contact-free cell body perimeter on the source-facing side of the cell to the total angular spread of contact-free cell body perimeter) of all the neurons responding to netrin. Blue circles denote the neurons that had axons growing towards the direction of the gradient, whereas the red circles denote the neurons that had axons turning away from the gradient. (B) and (C) Schematics of the accessibility coefficient calculations for sample neurons growing with the final position of their axon tips in the half facing the gradient (#2) and the half facing away from the gradient (#10). Scale Bar = 25 μm.
Fig. 6
Fig. 6
Characteristics of Dynamic Behavior of Axons in Response to Netrin: (A) A color-coded axon growth speed map, overlaid on individual axon trajectories – red and blue depict higher and lower speeds, respectively. (B) Histogram of axon growth speeds, divided into 10 equal bins (each bin = 5.9 μm/hr), and averaged, for the axons growing towards (blue) and the ones growing away (red) from the netrin gradient. The shaded region denotes the marked difference between the two populations of neurons. (C) Histogram distribution over time for the lowest speed bracket – 0 to 5.9 μm/hr, corresponding to the leftmost bars in (B) – for both populations of neurons (those growing towards and those growing away from the gradient). The yellow-highlighted region corresponds to the period of netrin gradient application. (D) Color-coded axon growth speed map overlaid on the trajectories of two representative neurons (the upper panel growing towards and the bottom one away from the gradient) showing the distribution of the lower (less than 5.9 μm/hr) and higher (over 37.4 μm/hr) speed bins over time. Note that the distribution of the lower speeds are clustered closer to the soma in cells growing towards the gradient (filled arrows) while they are clustered away from the soma in cells growing away from the gradient (empty arrows). Scale bar = 25 μm.

References

    1. Chilton JK. Developmental Biology. 2006;292:13–24. - PubMed
    1. Song HJ, Poo MM. Nature Cell Biology. 2001;3:E81–E88. - PubMed
    1. TessierLavigne M, Goodman CS. Science. 1996;274:1123–1133. - PubMed
    1. Ranscht B. International Journal of Developmental Neuroscience. 2000;18:643–651. - PubMed
    1. Skaper SD, Moore SE, Walsh FS. Progress in Neurobiology. 2001;65:593–608. - PubMed