

Cross-reactivity virtual profiling of the human kinome by X-react(KIN): a chemical systems biology approach
- PMID: 20958088
- PMCID: PMC2997910
- DOI: 10.1021/mp1002976
Cross-reactivity virtual profiling of the human kinome by X-react(KIN): a chemical systems biology approach
Abstract
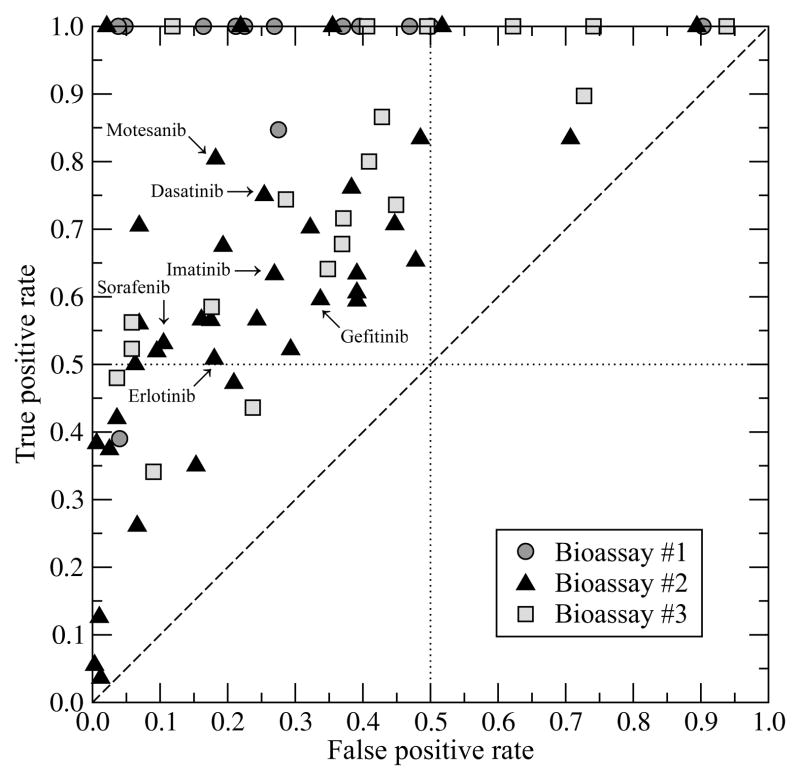
Many drug candidates fail in clinical development due to their insufficient selectivity that may cause undesired side effects. Therefore, modern drug discovery is routinely supported by computational techniques, which can identify alternate molecular targets with a significant potential for cross-reactivity. In particular, the development of highly selective kinase inhibitors is complicated by the strong conservation of the ATP-binding site across the kinase family. In this paper, we describe X-React(KIN), a new machine learning approach that extends the modeling and virtual screening of individual protein kinases to a system level in order to construct a cross-reactivity virtual profile for the human kinome. To maximize the coverage of the kinome, X-React(KIN) relies solely on the predicted target structures and employs state-of-the-art modeling techniques. Benchmark tests carried out against available selectivity data from high-throughput kinase profiling experiments demonstrate that, for almost 70% of the inhibitors, their alternate molecular targets can be effectively identified in the human kinome with a high (>0.5) sensitivity at the expense of a relatively low false positive rate (<0.5). Furthermore, in a case study, we demonstrate how X-React(KIN) can support the development of selective inhibitors by optimizing the selection of kinase targets for small-scale counter-screen experiments. The constructed cross-reactivity profiles for the human kinome are freely available to the academic community at http://cssb.biology.gatech.edu/kinomelhm/ .
Figures


Similar articles
-
Comprehensive structural and functional characterization of the human kinome by protein structure modeling and ligand virtual screening.J Chem Inf Model. 2010 Oct 25;50(10):1839-54. doi: 10.1021/ci100235n. J Chem Inf Model. 2010. PMID: 20853887 Free PMC article.
-
Pocketome of human kinases: prioritizing the ATP binding sites of (yet) untapped protein kinases for drug discovery.J Chem Inf Model. 2015 Mar 23;55(3):538-49. doi: 10.1021/ci500624s. Epub 2015 Jan 20. J Chem Inf Model. 2015. PMID: 25557645
-
Dissecting kinase profiling data to predict activity and understand cross-reactivity of kinase inhibitors.J Chem Inf Model. 2012 Apr 23;52(4):901-12. doi: 10.1021/ci200607f. Epub 2012 Mar 26. J Chem Inf Model. 2012. PMID: 22414491
-
Extending kinome coverage by analysis of kinase inhibitor broad profiling data.Drug Discov Today. 2015 Jun;20(6):652-8. doi: 10.1016/j.drudis.2015.01.002. Epub 2015 Jan 14. Drug Discov Today. 2015. PMID: 25596550 Review.
-
Chemical genomic and proteomic methods for determining kinase inhibitor selectivity.Comb Chem High Throughput Screen. 2007 Sep;10(8):652-66. doi: 10.2174/138620707782507368. Comb Chem High Throughput Screen. 2007. PMID: 18045078 Review.
Cited by
-
Are predicted protein structures of any value for binding site prediction and virtual ligand screening?Curr Opin Struct Biol. 2013 Apr;23(2):191-7. doi: 10.1016/j.sbi.2013.01.009. Epub 2013 Feb 14. Curr Opin Struct Biol. 2013. PMID: 23415854 Free PMC article. Review.
-
eMatchSite: sequence order-independent structure alignments of ligand binding pockets in protein models.PLoS Comput Biol. 2014 Sep 18;10(9):e1003829. doi: 10.1371/journal.pcbi.1003829. eCollection 2014 Sep. PLoS Comput Biol. 2014. PMID: 25232727 Free PMC article.
-
Local Alignment of Ligand Binding Sites in Proteins for Polypharmacology and Drug Repositioning.Methods Mol Biol. 2017;1611:109-122. doi: 10.1007/978-1-4939-7015-5_9. Methods Mol Biol. 2017. PMID: 28451975 Free PMC article.
-
Artificial intelligence to guide precision anticancer therapy with multitargeted kinase inhibitors.BMC Cancer. 2022 Nov 24;22(1):1211. doi: 10.1186/s12885-022-10293-0. BMC Cancer. 2022. PMID: 36434556 Free PMC article.
-
FINDSITE(X): a structure-based, small molecule virtual screening approach with application to all identified human GPCRs.Mol Pharm. 2012 Jun 4;9(6):1775-84. doi: 10.1021/mp3000716. Epub 2012 May 21. Mol Pharm. 2012. PMID: 22574683 Free PMC article.
References
-
- Manning G, Whyte DB, Martinez R, Hunter T, Sudarsanam S. The protein kinase complement of the human genome. Science. 2002;298 (5600):1912–34. - PubMed
-
- Hanks SK, Hunter T. Protein kinases 6. The eukaryotic protein kinase superfamily: kinase (catalytic) domain structure and classification. FASEB J. 1995;9 (8):576–96. - PubMed
-
- Kennelly PJ. Protein kinases and protein phosphatases in prokaryotes: a genomic perspective. FEMS Microbiol Lett. 2002;206 (1):1–8. - PubMed
-
- Blume-Jensen P, Hunter T. Oncogenic kinase signalling. Nature. 2001;411 (6835):355–65. - PubMed
-
- Sasase T. PKC -a target for treating diabetic complications. Drugs of the Future. 2006;31 (6):503–11.
Publication types
MeSH terms
Substances
Grants and funding
LinkOut - more resources
Full Text Sources
