Review
. 2010 Dec:1214:99-121.
doi: 10.1111/j.1749-6632.2010.05790.x. Epub 2010 Oct 19.

Disorders of dysregulated signal traffic through the RAS-MAPK pathway: phenotypic spectrum and molecular mechanisms

Affiliations
Review

Disorders of dysregulated signal traffic through the RAS-MAPK pathway: phenotypic spectrum and molecular mechanisms

Marco Tartaglia et al. Ann N Y Acad Sci. 2010 Dec.

Abstract

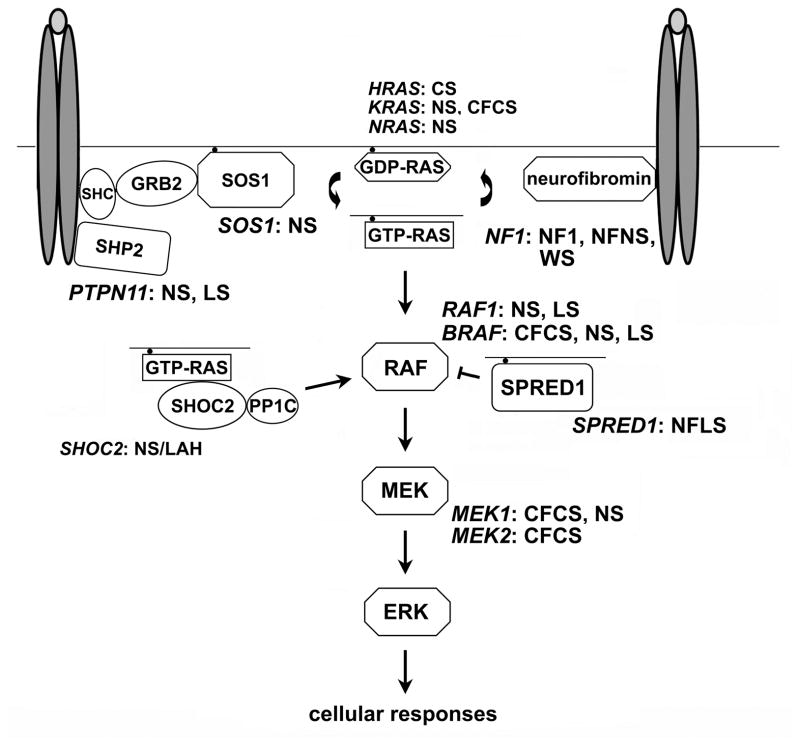
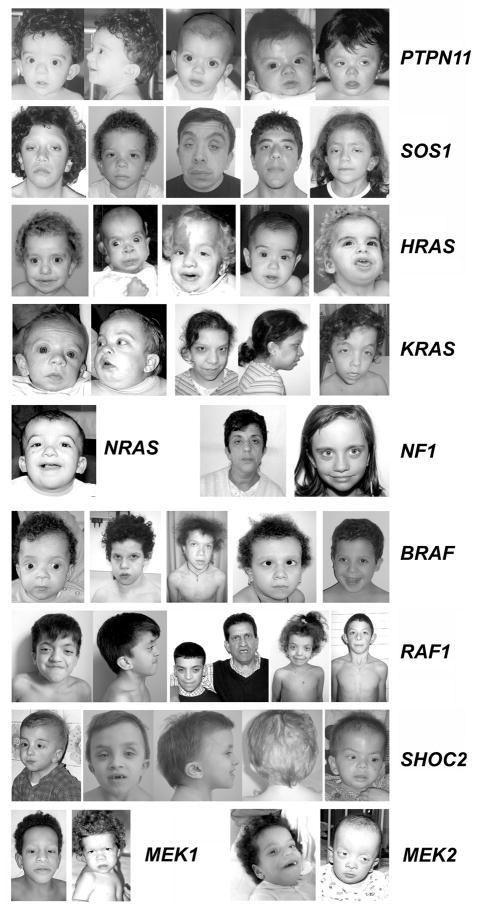
RAS GTPases control a major signaling network implicated in several cellular functions, including cell fate determination, proliferation, survival, differentiation, migration, and senescence. Within this network, signal flow through the RAF-MEK-ERK pathway-the first identified mitogen-associated protein kinase (MAPK) cascade-mediates early and late developmental processes controlling morphology determination, organogenesis, synaptic plasticity, and growth. Signaling through the RAS-MAPK cascade is tightly controlled; and its enhanced activation represents a well-known event in oncogenesis. Unexpectedly, in the past few years, inherited dysregulation of this pathway has been recognized as the cause underlying a group of clinically related disorders sharing facial dysmorphism, cardiac defects, reduced postnatal growth, ectodermal anomalies, variable cognitive deficits, and susceptibility to certain malignancies as major features. These disorders are caused by heterozygosity for mutations in genes encoding RAS proteins, regulators of RAS function, modulators of RAS interaction with effectors, or downstream signal transducers. Here, we provide an overview of the phenotypic spectrum associated with germline mutations perturbing RAS-MAPK signaling, the unpredicted molecular mechanisms converging toward the dysregulation of this signaling cascade, and major genotype-phenotype correlations.


Figures

Figure 1
Figure 1. Schematic diagram showing the RAS-MAPK signal transduction pathway and affected disease genes in disorders of the neuro-cardio-facial-cutaneous syndrome family
The double ovals in dark grey and the light grey ovals represent generic dimerized cell-surface receptors binding to their ligand. Abbreviations: CFCS, cardio-facio-cutaneous syndrome; CS: Costello syndrome; LS, LEOPARD syndrome; NF1, neurofibromatosis type 1; NFLS, Neurofibromatosis type 1-like syndrome (also termed Legius syndrome); NFNS, Neurofibromatosis-Noonan syndrome; NS, Noonan syndrome; NS/LAH, Noonan-like syndrome with loose anagen hair; WS, Watson syndrome.
Figure 2
Figure 2. Dysmorphic facial features in disorders of the neuro-cardio-facial-cutaneous syndrome family caused by RAS-MAPK signaling dysregulation
Series of affected individuals heterozygous for mutations in different disease genes are shown [courtesy of G. Zampino (Università Cattolica del Sacro Cuore, Rome, Italy), B. Dallapiccola and M.C. Digilio (Ospedale “Bambino Gesù”, Rome, Italy), G. Mancini (Erasmus Medical Center, Rotterdam, The Netherlands), G.B. Ferrero (Università di Torino, Turin, Italy), and M. Zenker (University Hospital, Magdeburg, Germany)].
Figure 3
Figure 3. PTPN11 gene organization, SHP2 domain structure and location of affected residues in human disease
(A) The PTPN11 gene and its encoded protein product. The numbered, filled boxes at the top indicate the coding exons; the positions of the ATG and TGA codons are shown. Exon location of disease-associated mutations is indicated (the number of asterisks is an index of the relative prevalence of mutations within each exon). SHP2’s functional domains, consisting of two tandemly arranged SH2 domains at the N-terminus (N-SH2 and C-SH2) followed by a protein tyrosine phosphatase (PTP) domain, are shown below. The numbers below that cartoon indicate the amino acid boundaries of those domains. (B) Location of mutated residues in the three dimensional structure of SHP2 in its catalytically inactive conformation. Residues affected by germline (left) or somatically acquired (right) mutations are shown with their lateral chains (yellow, mutations affecting the N-SH2/PTP interaction; green, mutations affecting the N-SH2/PTP interaction and possibly substrate specificity and/or catalysis; red, mutations promoting increased SH2 phosphopeptide binding affinity or affecting specificity; blue, mutations affecting SH2 orientation or mobility; black, unclassified). The identity of affected residues and amino acid substitutions, and the prevalence of mutations are listed in Tartaglia et al.
Figure 4
Figure 4. SOS1 domain structure and location of affected residues in NS
(A) SOS1 missense mutations are positioned below the cartoon of the SOS1 protein with its functional domains indicated above. Abbreviations: DH, Dbl homology domain; PH, plekstrin homology domain; Rem, RAS exchanger motif; PxxP, proline-rich region. (B) Location of the mutated residues on the three-dimensional structure of SOS1. The functional domains are color coded as follows: Histone folds, cyan; DH, magenta; PH, orange; Rem, green; Cdc25, yellow. Residues affected by mutations are indicated with their lateral chains (histone folds, violet; DH, blue; PH, green; helical linker, red; Rem, orange; Cdc25, cyan). Based on Sondermann et al., which utilized structural data and computational modeling.
Figure 5
Figure 5. Domain structure of RAS proteins and location of affected residues in NS, CFCS and CS
(A) Schematic diagram and tridimensional representation of the structural and functional domains defined within RAS proteins. The motifs required for signaling function (PM1 to PM3 indicate residues involved in binding to the phosphate groups, while G1 to G3 are those involved in binding to the guanine base) are indicated. The hypervariable region is shown in grey, together with the C-terminal motifs that direct post-translational processing and plasma membrane anchoring (dark grey). The GTP/GDP binding pocket is shown in cyan (guanine ring binding surface) and yellow (triphosphate group binding surface) together with the Switch I (forest green) and Switch II (magenta) domains, according to the GTP-bound RAS conformation. (B) Location of the KRAS residues mutated in NS and CFCS. Residues affected by mutations are indicated with their lateral chains (triphosphate group binding surface, orange; guanine ring binding surface, blue; Switch I, green; other regions; black). (C) Location of the HRAS residues mutated in CS. Residues affected by mutations are indicated with their lateral chains as reported above. (C) Location of the NRAS residues mutated in NS. Residues affected by mutations are indicated with their lateral chains as reported above.
Figure 6
Figure 6. RAF1 and BRAF domain structure and location of affected residues in human disease
The domains of the RAF1 (above) and BRAF (below) proteins are indicated (CR, conserved region; RBD, RAS binding domain, CRD, cysteine-rich domain). Germline (RAF1: NS and LS; BRAF: NS, LS and CFCS) and somatic (associated with cancer) mutations are reported above and below each cartoon, respectively. Only somatic BRAF mutations with prevalence ≥ 1.5%, according the COSMIC database (http://www.sanger.ac.uk/genetics/CGP/cosmic/) are reported. The BRAF Thr599Ile substitution, which rarely occurs in cancer and is homologous to the NS-causing RAF1 Thr491Ile change, is also reported. BRAF missense changes associated with a phenotype fitting NS or LS are colored blue and orange, respectively.
Figure 7
Figure 7. The disease-causing 4A > G (Ser2Gly) change in SHOC2 promotes protein myristoylation and cell membrane targeting
(A) SHOC2 genomic organization and protein structure. The coding exons are shown at the top as numbered filled boxes. Intronic regions are reported as dotted lines. SHOC2 motifs comprise an N-terminal lysine-rich region (grey coloured) followed by 19 leucine-rich repeats. Numbers above the domain structure indicate the amino acid boundaries of those domains. (B) Confocal laser scanning microscopy analysis documents that SHOC2wt (red) is uniformly distributed in the cytoplasm and nucleus (left) of transiently transfected Cos-1 cells (DMEM supplemented with 10% heat-inactivated FBS), while SHOC2S2G (red) co-localizes with ganglioside M1 (green) to the cell membrane. Nuclei are visualized by DAPI staining (blue). Bars indicate 20μm.

References

    1. Mitin N, Rossman KL, Der CJ. Signaling interplay in Ras superfamily function. Curr Biol. 2005;15:R563–574. - PubMed
    1. Karnoub AE, Weinberg RA. Ras oncogenes: split personalities. Nat Rev Mol Cell Biol. 2008;9:517–531. - PMC - PubMed
    1. Sundaram MV. RTK/Ras/MAPK signaling. WormBook. 2006;11:1–19. - PubMed
    1. McKay MM, Morrison DK. Integrating signals from RTKs to ERK/MAPK. Oncogene. 2007;26:3113–3121. - PubMed
    1. Bos JL. Ras oncogenes in human cancer: a review. Cancer Res. 1989;49:4682–4689. - PubMed

Publication types

MeSH terms

Substances