. 2010 Oct 19:10:314.
doi: 10.1186/1471-2148-10-314.

The imprint of the Slave Trade in an African American population: mitochondrial DNA, Y chromosome and HTLV-1 analysis in the Noir Marron of French Guiana

Affiliations

The imprint of the Slave Trade in an African American population: mitochondrial DNA, Y chromosome and HTLV-1 analysis in the Noir Marron of French Guiana

Nicolas Brucato et al. BMC Evol Biol. .

Abstract

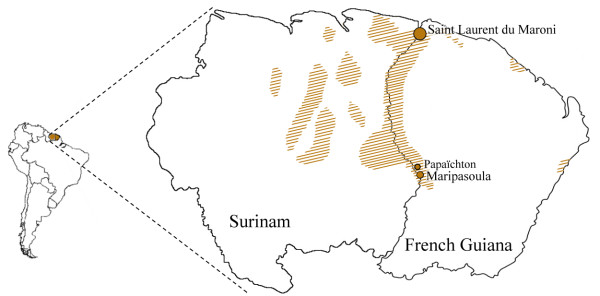
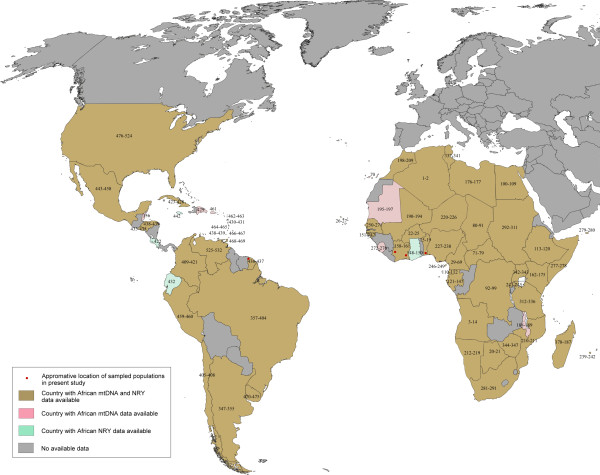
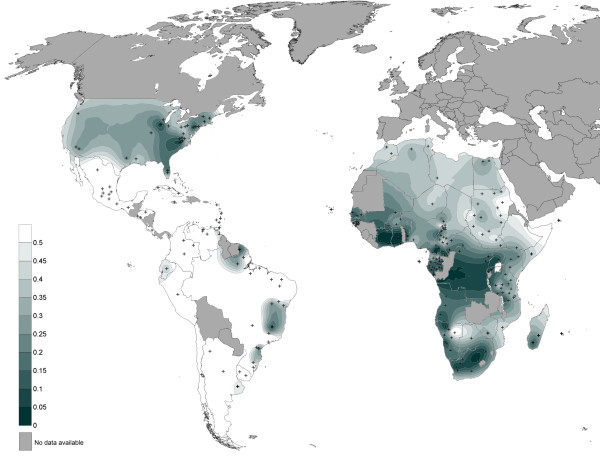
Background: Retracing the genetic histories of the descendant populations of the Slave Trade (16th-19th centuries) is particularly challenging due to the diversity of African ethnic groups involved and the different hybridisation processes with Europeans and Amerindians, which have blurred their original genetic inheritances. The Noir Marron in French Guiana are the direct descendants of maroons who escaped from Dutch plantations in the current day Surinam. They represent an original ethnic group with a highly blended culture. Uniparental markers (mtDNA and NRY) coupled with HTLV-1 sequences (env and LTR) were studied to establish the genetic relationships linking them to African American and African populations.

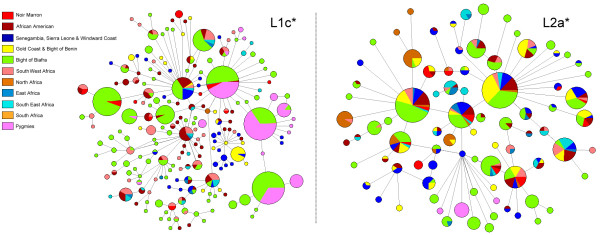
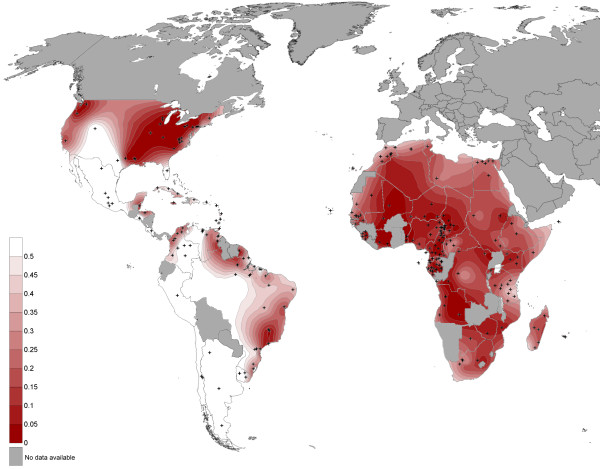
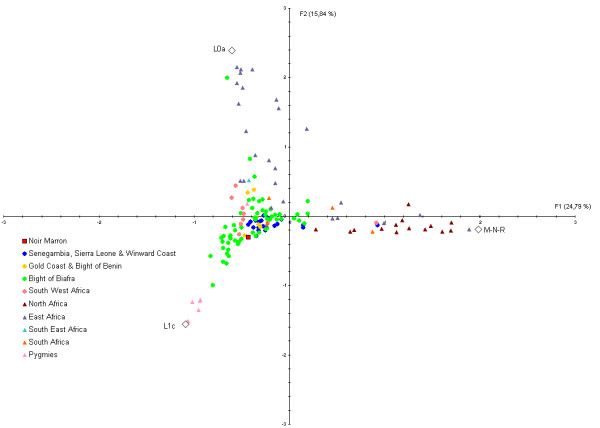
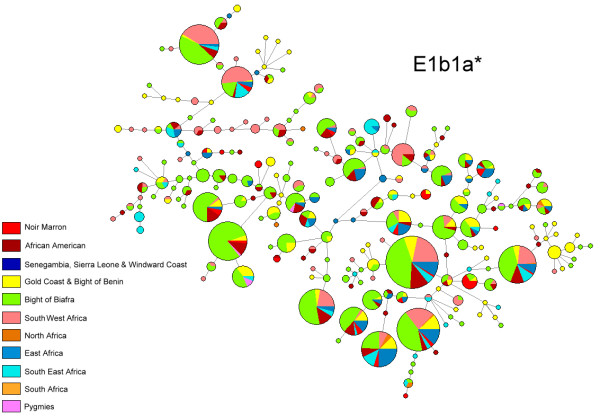
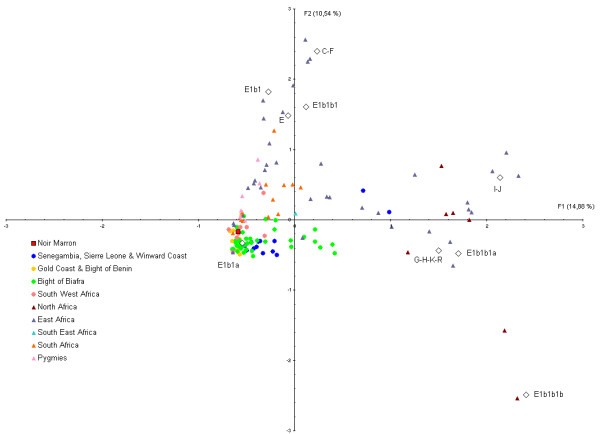
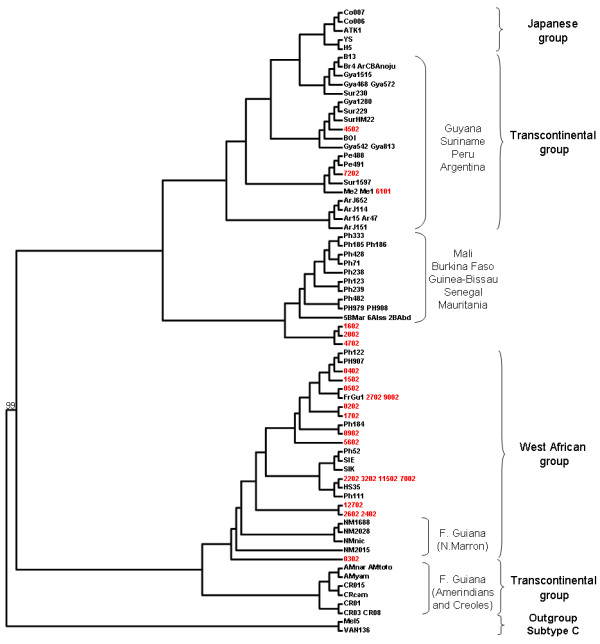
Results: All genetic systems presented a high conservation of the African gene pool (African ancestry: mtDNA = 99.3%; NRY = 97.6%; HTLV-1 env = 20/23; HTLV-1 LTR = 6/8). Neither founder effect nor genetic drift was detected and the genetic diversity is within a range commonly observed in Africa. Higher genetic similarities were observed with the populations inhabiting the Bight of Benin (from Ivory Coast to Benin). Other ancestries were identified but they presented an interesting sex-bias. Whilst male origins spread throughout the north of the bight (from Benin to Senegal), female origins were spread throughout the south (from the Ivory Coast to Angola).

Conclusions: The Noir Marron are unique in having conserved their African genetic ancestry, despite major cultural exchanges with Amerindians and Europeans through inhabiting the same region for four centuries. Their maroon identity and the important number of slaves deported in this region have maintained the original African diversity. All these characteristics permit to identify a major origin located in the former region of the Gold Coast and the Bight of Benin; regions highly impacted by slavery, from which goes a sex-biased longitudinal gradient of ancestry.


Figures

Figure 1
Figure 1
Geographic location of the Noir Marron communities sampled. The brown hatched areas locate the Noir Marron communities in Surinam and in French Guiana. The brown points represent the communities sampled and their relative size depends to the number of sampled individuals.
Figure 2
Figure 2
Geographic locations of populations analysed in the study. Each number refers to a unique group characterised by its ethnic name, country, the genetic system studied and the author of the corresponding study. The nomenclature and the references are available in Additional file 1.
Figure 3
Figure 3
Median-joining phylogenetic trees of Noir Marron, African and African American mitochondrial HVS-I haplotypes belonging to haplogroups L1c* and L2a*.
Figure 4
Figure 4
Map of Fst values obtained for the pairwise comparison of the Noir Marron maternal lineages with those of Africans, African Americans and urban Americans. The red colour scale represents the Fst values calculated between the mtDNA data of the Noir Marron and the populations of interest represented by black crosses.
Figure 5
Figure 5
Plot showing the 1st and 2nd principal component of the FCA computed from the mtDNA haplogroup frequencies of the Noir Marron and African populations. Square point represents the Noir Marron population, circle points the West African and South West African populations, and all other groups are represented by triangular points. The colours identify the groups considered in the present study.
Figure 6
Figure 6
Median-joining phylogenetic trees of Noir Marron, African and African American Y-chromosome STR haplotypes belonging to haplogroups E1b1a*.
Figure 7
Figure 7
Map of Fst values obtained for the pairwise comparison of the Noir Marron paternal lineages with those of Africans, African Americans and urban Americans. The green colour scale represents the Fst values calculated between the NRY data of the Noir Marron and the populations of interest, which are represented by black crosses.
Figure 8
Figure 8
Plot showing the 1st and 2nd principal component of the FCA computed from the NRY haplogroup frequencies of the Noir Marron and African populations. Square point represents the Noir Marron population, circle points the West African and South West African populations, and all other groups are represented by triangular points. The colours identify the groups considered in the present study.
Figure 9
Figure 9
Env phylogenetic tree generated using the Neighbor-Joining method performed in the PAUP program (v4.0b10) on a 519-bp fragment of the Env gene using 75 HTLV-1 available sequences available in Genbank. The new Noir Marron data are coded in red. The Noir Marron data already published are coded "NM". The Mel5 and VAN136 strains were used as out-group. The HTLV-1 strains were aligned with the DAMBE program (version 4.2.13). The final alignment was submitted to the Modeltest program (version 3.6) to select, according to the Akaike Information Criterion (AIC), the best model to apply to phylogenetic analyses. The selected model was the GTR. Bootstrap support (1,000 replicates) is noted on the branch of the tree.

References

    1. Klein HS. The Atlantic Slave Trade. Cambridge: Cambridge University Press; 1999.
    1. Eltis D, Behrendt SD, Richardson D, Klein HS. The Trans-Atlantic Slave Trade: A Database on CD-ROM. Cambridge; 1999.
    1. Price R, Price S. Les Marrons en Guyane. Châteauneuf-le-Rouge: Vents d'Ailleurs. 2002.
    1. Muniz YC, Ferreira LB, Mendes-Junior CT, Wiezel CE, Simoes AL. Genomic ancestry in urban Afro-Brazilians. Ann Hum Biol. 2008;35(1):104–111. doi: 10.1080/03014460701782256. - DOI - PubMed
    1. Bortolini MC, Da Silva WAJW, De Guerra DC, Remonatto G, Mirandola R, Hutz MH, Weimer TA, Silva MC, Zago MA, Salzano FM. African-derived South American populations: A history of symmetrical and asymmetrical matings according to sex revealed by bi- and uni-parental genetic markers. Am J Hum Biol. 1999;11(4):551–563. doi: 10.1002/(SICI)1520-6300(1999)11:4<551::AID-AJHB15>3.0.CO;2-Z. - DOI - PubMed

Publication types

Substances

LinkOut - more resources