. 2010 Oct 20;99(8):2686-94.
doi: 10.1016/j.bpj.2010.08.012.

Multicolor fluorescence nanoscopy in fixed and living cells by exciting conventional fluorophores with a single wavelength

Affiliations

Multicolor fluorescence nanoscopy in fixed and living cells by exciting conventional fluorophores with a single wavelength

Ilaria Testa et al. Biophys J. .

Abstract

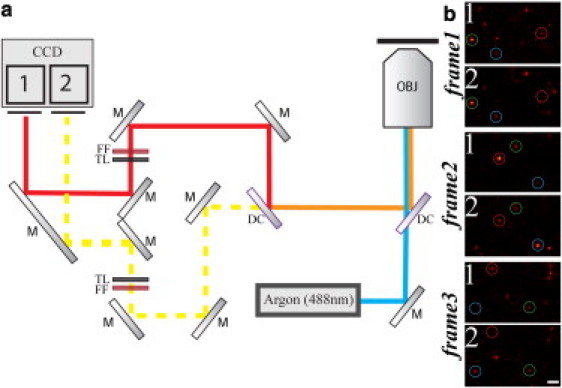
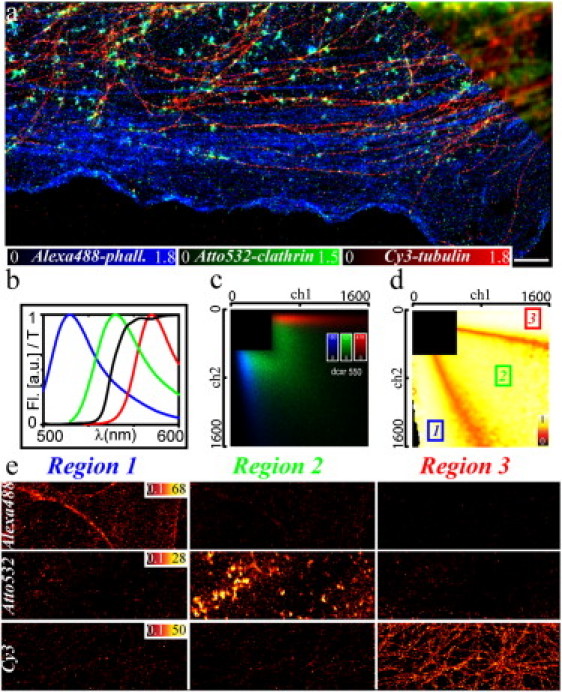
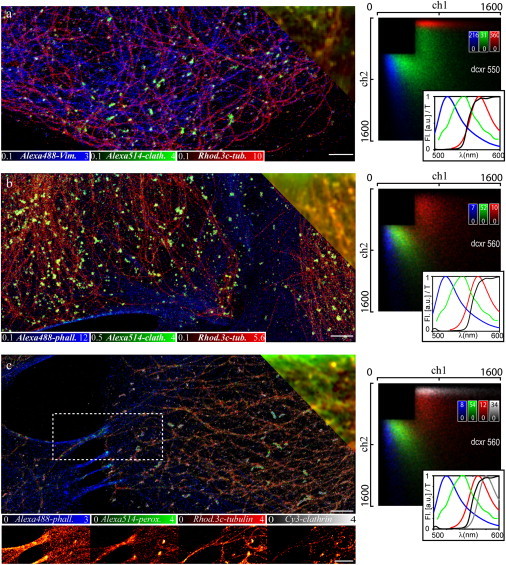
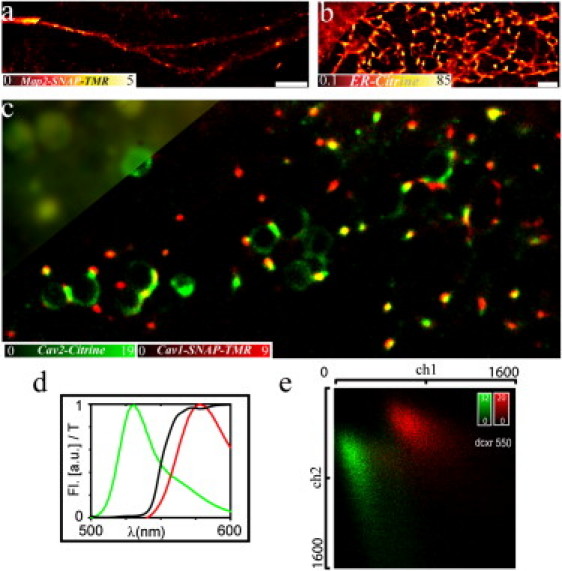
Current far-field fluorescence nanoscopes provide subdiffraction resolution by exploiting a mechanism of fluorescence inhibition. This mechanism is implemented such that features closer than the diffraction limit emit separately when simultaneously exposed to excitation light. A basic mechanism for such transient fluorescence inhibition is the depletion of the fluorophore ground state by transferring it (via a triplet) in a dark state, a mechanism which is workable in most standard dyes. Here we show that microscopy based on ground state depletion followed by individual molecule return (GSDIM) can effectively provide multicolor diffraction-unlimited resolution imaging of immunolabeled fixed and SNAP-tag labeled living cells. Implemented with standard labeling techniques, GSDIM is demonstrated to separate up to four different conventional fluorophores using just two detection channels and a single laser line. The method can be expanded to even more colors by choosing optimized dichroic mirrors and selecting marker molecules with negligible inhomogeneous emission broadening.


Figures

Figure 1
Figure 1
(a) Multicolor nanoscopy setup based on GSDIM, which is essentially a wide-field microscope equipped with a single continuous-wave laser source (Argon 488 nm) and a fast EMCCD camera. Fluorescence is collected by a microscope objective with high numerical aperture (OBJ), separated from the excitation light by a dichroic mirror (DC), split by another dichroic mirror (DC) into two wavelength ranges, and imaged onto two separate areas (area 1 and area 2) of the same EMCCD chip. Labels: (M) Mirror; (FF) fluorescence filter; (TL) tube lens. (b) Three consecutive exemplary camera frames of our GSDIM recordings of Fig. 2 showing on-off blinking of single isolated fluorophores with different ratios of signal counts in the area 1 (>550 nm) and area 2 (<550 nm) of the camera (blue circle, Alexa488 assignment; green circle, Atto532 assignment; red circle, Cy3 assignment). Scale bar 1 μm.
Figure 2
Figure 2
Three-color GSDIM of fixed cells. (a) Nanoscopy and conventional wide-field (upper right corner) image of three different structures in fixed PtK2 cells: Alexa488-phalloidin labeled F-actin (blue), Atto532-marked clathrin (green), and Cy3-labeled tubulin (red). (b) Fluorescence emission spectra (Fl) of Alexa488 (blue), Atto532 (green), and Cy3 (red) and transmission characteristic (T) of the dichroic mirror (black). (c) Two-dimensional histogram of photon pairs simultaneously registered in the two detection channels from the control experiments on single-stained samples; colors and structures as in panel a. (d) Two-dimensional photon pair assignment distribution constructed from panel c. Photon pairs of region 1 are assigned to Alexa488, of region 2 to Atto532 and of region 3 to Cy3. The color table encodes the confidence of assignment, i.e., the probability of a correct assignment if all marker species are assumed to occur with the same frequency. It drops to ∼50% in regions where the distributions in panel b strongly overlap but events are less probable. Black regions are excluded due to photon thresholds or insufficient calibration data. The assignment cross-talk could be further reduced at the cost of dynamic range by excluding regions where the confidence is below a certain threshold. (e) Nanoscopy images of the single-stained samples (upper panels, Alexa488-f-actin; middle panels, Atto532-clathrin; lower panels, Cy3-tubulin) for each assigned color (left panels, Alexa488 assignment, region 1 of panel d; middle panels, Atto532 assignment, region 2 of panel d; right panels, Cy3 assignment, region 3 of panel d). The probability of false classification or the assignment cross-talk is <10%. I = 10 kW/cm2, 90,000 camera frames, frame time 13 ms, scale bar 2 μm.
Figure 3
Figure 3
Multicolor GSDIM nanoscopy and conventional wide-field (upper right corner) images of different structures in fixed PtK2 cells. (a) Alexa488-labeled vimentin (blue), Alexa514-labeled clathrin (green), and Rhodamine 3c-labeled tubulin (red) recorded with a dichroic mirror centered at 550 nm. (b) Alexa488-labeled F-actin (blue), Alexa514-labeled clathrin (green), and Rhodamine 3c-labeled tubulin (red) recorded with a dichroic mirror centered at 560 nm. (c) Alexa488-labeled F-actin (blue), Alexa514-labeled peroxisomes (green), Rhodamine 3c-labeled tubulin (red), and Cy3-labeled clathrin (white). (Lower images) Contribution of each color for the section marked by the dotted white box. (Right panels) Corresponding two-dimensional photon pair histograms from control experiments on single-stained samples and (inset) fluorescence emission spectra (Fl) of the employed dyes (colors as in the images) and transmission characteristic (T) of the dichroic mirror (black). I = 10 kW/cm2, 90,000 (a and b) and 180,000 (c) camera frames, frame time 13 ms, scale bar 2 μm.
Figure 4
Figure 4
(a) Exemplary fluorescence emission spectra of four different dyes (1, Alexa488; 2, Alexa514; 3, Rhodamine 3c; and 4, Cy3) and different transmission curves of the dichroic mirror (black; Dichroic, dichroic mirror as employed in the experiments; Step, theoretical; and Ramp, theoretical) used to split the fluorescence light into the two detection channels. (b) Corresponding simulated two-dimensional photon pair distributions.
Figure 5
Figure 5
Multicolor live-cell GSDIM. Nanoscopic and conventional wide-field (upper left corner) images of different structures in living PtK2 cells. (a) Microtubule-associated protein 2 fused with a SNAP-tag and labeled with the organic dye TMR, (b) Citrine targeted to the endoplasmatic reticulum (ER), and (c) Caveolin 1 (red) and Caveolin 2 (green) labeled with TMR via SNAP tag and Citrine, respectively. (d) Fluorescence emission spectra (Fl) of TMR (red) and Citrine (green) and transmission characteristic (T) of the dichroic mirror. (e) Two-dimensional photon pair histogram from control experiments on single-stained samples of panels a and b. I = 2 kW/cm2, 1000 camera frames, frame time 10 ms, scale bar 2 μm.

References

    1. Abbe E. Contributions to the theory of the microscope and microscopic perception [Beiträge zur Theorie des Mikroskops und der mikroskopischen Wahrnehmung] Archiv für Mikroskopische Anatomie. 1873;9:413–468.
    1. Hell S.W., Wichmann J. Breaking the diffraction resolution limit by stimulated emission: stimulated-emission-depletion fluorescence microscopy. Opt. Lett. 1994;19:780–782. - PubMed
    1. Hell S.W., Jakobs S., Kastrup L. Imaging and writing at the nanoscale with focused visible light through saturable optical transitions. Appl. Phys., A Mater. Sci. Process. 2003;77:859–860.
    1. Hell S.W. Far-field optical nanoscopy. Science. 2007;316:1153–1158. - PubMed
    1. Hell S.W., Kroug M. Ground-state depletion fluorescence microscopy, a concept for breaking the diffraction resolution limit. Appl. Phys. B. 1995;60:495–497.

Publication types

Substances

LinkOut - more resources