. 2011 Mar;39(4):1501-9.
doi: 10.1093/nar/gkq920. Epub 2010 Oct 18.

Identification of RNA recognition elements in the Saccharomyces cerevisiae transcriptome

Affiliations

Identification of RNA recognition elements in the Saccharomyces cerevisiae transcriptome

Daniel P Riordan et al. Nucleic Acids Res. 2011 Mar.

Abstract

Post-transcriptional regulation of gene expression, including mRNA localization, translation and decay, is ubiquitous yet still largely unexplored. How is the post-transcriptional regulatory program of each mRNA encoded in its sequence? Hundreds of specific RNA-binding proteins (RBPs) appear to play roles in mediating the post-transcriptional regulatory program, akin to the roles of specific DNA-binding proteins in transcription. As a step toward decoding the regulatory programs encoded in each mRNA, we focused on specific mRNA-protein interactions. We computationally analyzed the sequences of Saccharomyces cerevisiae mRNAs bound in vivo by 29 specific RBPs, identifying eight novel candidate motifs and confirming or extending six earlier reported recognition elements. Biochemical selections for RNA sequences selectively recognized by 12 yeast RBPs yielded novel motifs bound by Pin4, Nsr1, Hrb1, Gbp2, Sgn1 and Mrn1, and recovered the known recognition elements for Puf3, She2, Vts1 and Whi3. Most of the RNA elements we uncovered were associated with coherent mRNA expression changes and were significantly conserved in related yeasts, supporting their functional importance and suggesting that the corresponding RNA-protein interactions are evolutionarily conserved.


Figures
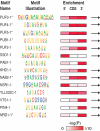
Figure 1.
Figure 1.
Computationally identified sequence motifs enriched in mRNAs bound by specific RBPs. RNA motifs identified from analysis of mRNA target sequences are displayed in decreasing order of significance based on P-values for genome-wide enrichment. A pictogram (http://genes.mit.edu/pictogram.html) represents the regular expression patterns defined for FIRE motifs or the preferred base composition of the position-specific scoring matrices used for REFINE motifs. For each motif, the −log10 P-value of the significance of genome-wide enrichment for motif sites in targets is shown in a red color scale for separate regions of its mRNA targets (5′ = 200 bases upstream of start codon, CDS = protein coding sequence, 3′ = 200 bases downstream of stop codon). Arrows are shown for motifs with a forward strand bias, i.e. the reverse complement of the motif is not significantly enriched in targets (P > 0.01). All relevant P-values were calculated based on the hyper-geometric distribution. Asterisks denote motifs that correspond to previously reported binding sites for the associated RBP. Exact data values and supporting details are presented in Supplementary Data S1.
Figure 2.
Figure 2.
Enrichment of RNA motifs in diverse RBP target sets. A heatmap illustrates the degree to which each of the identified RNA sequence motifs from Figure 1 (rows) is significantly over-represented or under-represented in the sequences of the set of target mRNAs bound by different RBPs (columns). Cells are either shaded in red to indicate the −log10 P-value of the significance of over-representation of motifs, or likewise shaded in blue for under-represented motifs. The red squares along the diagonal reflect the fact that each RNA motif was originally defined based on its strong over-representation within the target sequences of its cognate RBP. All P-values were calculated based on the hyper-geometric distribution. Asterisks denote motifs that correspond to previously reported binding sites for the associated RBP. Exact data values and supporting details are presented in Supplementary Data S2.
Figure 3.
Figure 3.
RNA recognition elements determined by in vitro selection. RNA motifs determined by analysis of SELEX clone sequences are depicted for each RBP. The −log10 P-values of the significance of motif enrichment in clones from the two distinct SELEX libraries (‘L1’ and ‘L2’) are represented in a red color scale. For each motif, the −log10 P-value of the significance of genome-wide enrichment for motif sites in segments of its mRNA targets bound in vivo is also color-coded. Motifs are listed in the order they are discussed in the text. The gray box indicates data are not available because all L2 clones inadvertently contain an Hrb1 motif site in their 3′ constant region. Asterisks denote motifs that correspond to previously reported binding sites for the associated RBP. For exact data values and details see Supplementary Data S3.
Figure 4.
Figure 4.
Conservation of RNA elements in Saccharomyces. Phylogenetic conservation rates of all sites for each RNA motif were calculated between S. cerevisiae and each of six related Saccharomyces species (par, paradoxus; mik, mikatae; kud, kudriavzevii; bay, bayanus; cas, castellii; klu, kluyveri) based on multiple alignments of the indicated genomic regions. For ‘Overall Conservation', each cell is shaded according to the −log10 P-value measuring if the observed conservation rate of motif sites in that species is significantly greater than expected by chance based on randomized alignments. For ‘target conservation', the cell for each species is shaded to depict the −log10 P-value measuring if the conservation rate of motif sites present within sequences of target mRNAs bound by the cognate RBP is significantly greater than the conservation rate of motif sites from all other transcripts. All P-values were calculated based on the hyper-geometric distribution. Asterisks denote motifs that correspond to previously reported binding sites for the associated RBP. For exact data values and details see Supplementary Data S4.
Figure 5.
Figure 5.
mRNA expression changes associated with RNA motifs. A heatmap illustrates the degree to which the relative expression levels of mRNAs containing each of the identified RNA sequence motifs (rows) changed under each of the environmental stress conditions shown (columns). For each motif and each stress condition we calculated the t-value measuring how much the average expression change of mRNAs with motif sites deviated from its expected value by chance. Relative increases in average mRNA expression levels are colored in red, and relative decreases are colored in green. For exact data values and supporting details see Supplementary Data S5.

References

    1. Hogan DJ, Riordan DP, Gerber AP, Herschlag D, Brown PO. Diverse RNA-binding proteins interact with functionally related sets of RNAs, suggesting an extensive regulatory system. PLoS Biol. 2008;6:e255. - PMC - PubMed
    1. Keene JD. RNA regulons: coordination of post-transcriptional events. Nat. Rev. Genet. 2007;8:533–543. - PubMed
    1. Gerber AP, Herschlag D, Brown PO. Extensive association of functionally and cytotopically related mRNAs with Puf family RNA-binding proteins in yeast. PLoS Biol. 2004;2:E79. - PMC - PubMed
    1. Hieronymus H, Silver PA. Genome-wide analysis of RNA–protein interactions illustrates specificity of the mRNA export machinery. Nat. Genet. 2003;33:155–161. - PubMed
    1. Shepard KA, Gerber AP, Jambhekar A, Takizawa PA, Brown PO, Herschlag D, DeRisi JL, Vale RD. Widespread cytoplasmic mRNA transport in yeast: identification of 22 bud-localized transcripts using DNA microarray analysis. Proc. Natl Acad. Sci. USA. 2003;100:11429–11434. - PMC - PubMed

Publication types

MeSH terms