. 2010 Dec 31;285(53):41637-45.
doi: 10.1074/jbc.M110.137885. Epub 2010 Oct 19.

Enhancement of reactive oxygen species production and chlamydial infection by the mitochondrial Nod-like family member NLRX1

Affiliations

Enhancement of reactive oxygen species production and chlamydial infection by the mitochondrial Nod-like family member NLRX1

Ali A Abdul-Sater et al. J Biol Chem. .

Abstract

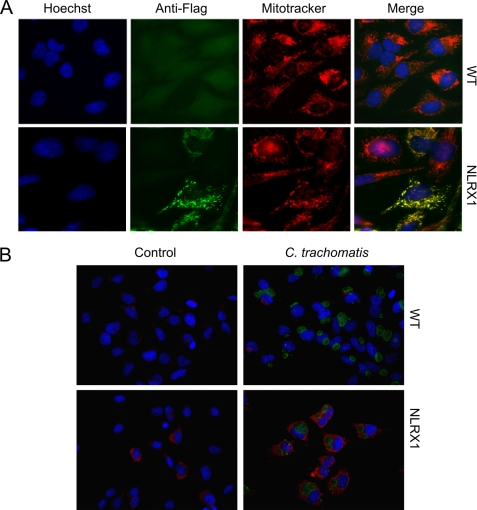
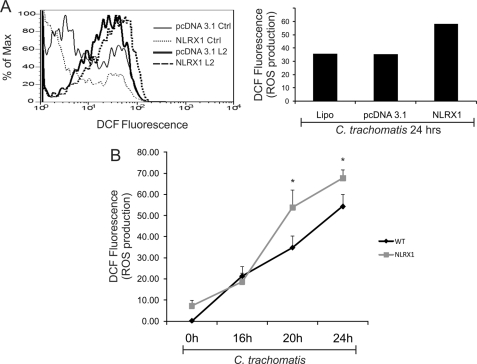
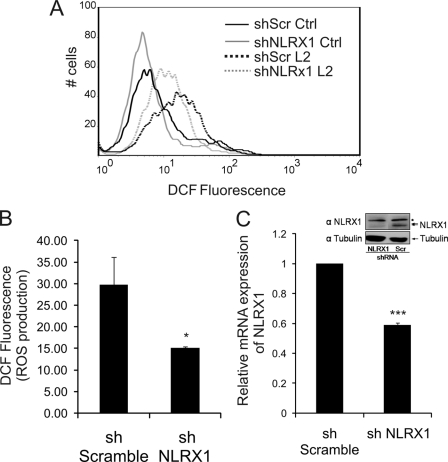
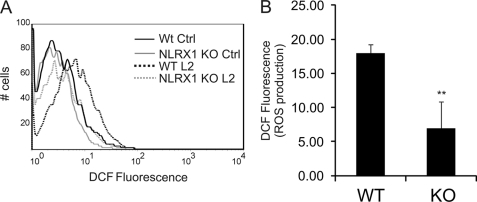
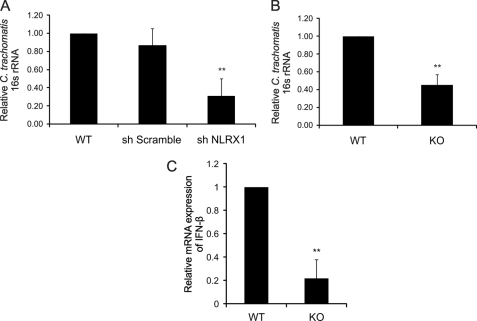
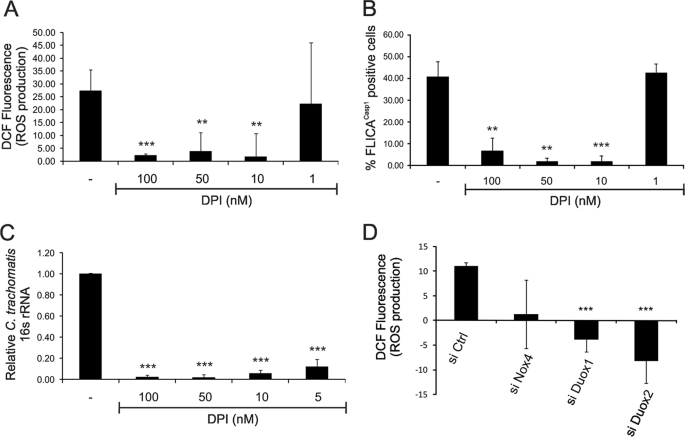
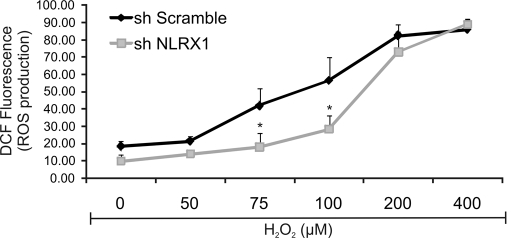
Chlamydia trachomatis infections cause severe and irreversible damage that can lead to infertility and blindness in both males and females. Following infection of epithelial cells, Chlamydia induces production of reactive oxygen species (ROS). Unconventionally, Chlamydiae use ROS to their advantage by activating caspase-1, which contributes to chlamydial growth. NLRX1, a member of the Nod-like receptor family that translocates to the mitochondria, can augment ROS production from the mitochondria following Shigella flexneri infections. However, in general, ROS can also be produced by membrane-bound NADPH oxidases. Given the importance of ROS-induced caspase-1 activation in growth of the chlamydial vacuole, we investigated the sources of ROS production in epithelial cells following infection with C. trachomatis. In this study, we provide evidence that basal levels of ROS are generated during chlamydial infection by NADPH oxidase, but ROS levels, regardless of their source, are enhanced by an NLRX1-dependent mechanism. Significantly, the presence of NLRX1 is required for optimal chlamydial growth.


Figures

FIGURE 1.
FIGURE 1.
NLRX1 translocation to mitochondria in infected and uninfected cells. HeLa cells growing on coverslips were transfected using Lipofectamine 2000 reagent with the NLRX1-FLAG construct and infected or mock-infected with the LGV/L2 strain of C. trachomatis at an m.o.i. of 3 for 24 h. A, uninfected cells were fixed and stained with Hoechst stain (blue), MitoTracker® (red), and anti-FLAG antibody (green). B, infected cells were stained with Cy3-conjugated anti-FLAG antibody (red) and anti-chlamydial antibody (green). In both cases, the cells were visualized on a fluorescence microscope. WT, wild-type (Lipofectamine only).
FIGURE 2.
FIGURE 2.
NLRX1 overexpression augments C. trachomatis-induced ROS production. HeLa cells were transfected using Lipofectamine 2000 reagent (Lipo) with empty vector (pcDNA3.1) or the NLRX1-FLAG construct and infected or mock-infected with the LGV/L2 strain of C. trachomatis at an m.o.i. of 3. A, cells were infected or mock-infected for 24 h. ROS production was measured with the ROS-sensitive dye DCF and analyzed by flow cytometry. Non-fluorescent cells were gated in the first log decade, and the fluorescence intensity was proportional to the level of ROS production. Flow cytometry data of infected cells are presented as a histogram (left panel), and the amount of ROS production in infected cells relative to uninfected controls (Ctrl) is presented as a bar chart (right panel). Data are from one representative experiment. B, cells were infected or mock-infected for 0, 16, 20, or 24 h, and ROS production was measured by flow cytometry under the same conditions as described for A. Relative ROS levels were quantified as the mean DCF fluorescence, and the values measured in uninfected wild-type cells were subtracted from the other conditions. Error bars represent S.D. (n = 3). *, p < 0.05 compared with wild-type infected cells (Lipofectamine only).
FIGURE 3.
FIGURE 3.
NLRX1 contributes to C. trachomatis-induced ROS production in epithelial cells. HeLa cells were transfected using Lipofectamine 2000 reagent with scrambled (shScr Ctrl) and NLRX1 (shNLRX1) shRNA constructs and infected or mock-infected with C. trachomatis at an m.o.i. of 3 for 24 h. A, ROS production was measured with DCF and analyzed by flow cytometry. Non-fluorescent cells were gated in the first log decade, and the fluorescence intensity was proportional to the level of ROS production. B, the bar chart represents ROS production in C. trachomatis-infected HeLa cells analyzed by flow cytometry under the conditions described for A. C, mRNA expression of NLRX1 was quantified by real-time PCR and compared with the scrambled shRNA (sh Scramble). Inset, HeLa cells were transduced for 72 h with lentiviruses expressing either NLRX1 shRNA or scrambled shRNA (Scr shRNA), and NLRX1 expression was determined by Western blotting using anti-NLRX1 antibody. Protein loading was controlled using an anti-tubulin antibody. The asterisk indicates a nonspecific band. Error bars represent S.D. (n = 3). *, p < 0.05; ***, p < 0.001 compared with scrambled shRNA-infected cells.
FIGURE 4.
FIGURE 4.
NLRX1 contributes to C. trachomatis-induced ROS production in murine fibroblasts. Wild-type (WT) or Nlrx1 knock-out (KO) MEFs were infected or mock-infected with C. trachomatis at an m.o.i. of 3 for 24 h. A, ROS production was measured with DCF and analyzed by flow cytometry. Non-fluorescent cells were gated in the first log decade, and the fluorescence intensity was proportional to the level of ROS production. B, the bar chart represents ROS production in C. trachomatis-infected MEF cells analyzed by flow cytometry under the conditions described for A. Error bars represent S.D. (n = 3). **, p < 0.01 compared with wild-type infected cells. Ctrl, control.
FIGURE 5.
FIGURE 5.
NLRX1 expression enhances chlamydial growth. A, HeLa cells were transfected using Lipofectamine 2000 reagent with scrambled (sh Scramble) and NLRX1 (sh NLRX1) shRNA constructs and infected with C. trachomatis at an m.o.i. of 3 for 24 h. B and C, wild-type (WT) or Nlrx1 knock-out (KO) MEFs were infected with C. trachomatis at an m.o.i. of 3 for 24 h. Infection and IFN-β levels were quantified by real-time PCR. Total RNA was harvested for quantification of chlamydial 16 S rRNA production (A and B) or IFN-β expression (C) using real-time PCR as described under “Experimental Procedures”. Error bars represent S.D. of at least three separate experiments. **, p < 0.01 compared with infected cells treated with Lipofectamine only (A, WT) or wild-type cells (B and C).
FIGURE 6.
FIGURE 6.
Chlamydia-induced ROS production requires NADPH oxidase in epithelial cells. A and B, HeLa cells were infected or mock-infected with C. trachomatis at an m.o.i. of 3 for 24 h in the presence of 0, 1, 10, 50, or 100 nm DPI (NOX and DUOX inhibitor) during the last 9 h of infection. A, ROS production was quantified by staining cells with DCF and measuring by flow cytometry. B, caspase-1 activation was quantified using fluorescent FLICACasp1 reagent and measuring by flow cytometry. C, HeLa cells were infected or mock-infected with C. trachomatis at an m.o.i. of 3 for 24 h and treated with 0, 5, 10, 50, or 100 nm DPI during the last 9 h of infection. Total RNA was harvested for quantification of chlamydial 16 S rRNA production using real-time PCR as described under “Experimental Procedures.” D, HeLa cells were transfected with control (si Ctrl), NOX4 (si Nox4), DUOX1 (si Duox1), and DUOX2 (si Duox2) siRNA constructs and infected or mock-infected with C. trachomatis at an m.o.i. of 3 for 24 h. ROS production was quantified by staining the cells with DCF and measuring ROS by flow cytometry. Error bars represent S.D. of at least three separate experiments. **, p < 0.01; ***, p < 0.001 compared with infected untreated cells (A–C) or with uninfected cells treated with control siRNA (D).
FIGURE 7.
FIGURE 7.
Exogenous ROS leads to further ROS generation in an NLRX1-dependent manner. HeLa cells were transfected using Lipofectamine 2000 reagent with scrambled (sh Scramble) and NLRX1 (sh NLRX1) shRNA constructs, and exogenous hydrogen peroxide (H2O2) was added at concentrations varying from 50 to 400 μm for 45 min. ROS production was measured with DCF and analyzed by flow cytometry. Non-fluorescent cells were gated in the first log decade, and the fluorescence intensity was proportional to the level of ROS production. Error bars represent S.D. of at least three separate experiments. *, p < 0.05, NLRX1 shRNA-treated cells compared with scrambled shRNA-treated cells.
FIGURE 8.
FIGURE 8.
NADPH oxidase and NLRX1-mediated mitochondrial production of ROS in response to C. trachomatis infection. Following infection, Chlamydiae inject virulence factors via the type 3 secretion (T3S) apparatus into the host cell cytosol, causing efflux of potassium, activation of NADPH oxidase, and production of ROS. ROS generated during chlamydial infection comes from two sources: NOX/DUOX and NLRX1. ROS then leads to NLRP3-mediated caspase-1 (Casp1) activation, which is required for optimal chlamydial growth. ASC, apoptosis-associated speck-like protein.

References

    1. Woo H. A., Yim S. H., Shin D. H., Kang D., Yu D. Y., Rhee S. G. (2010) Cell 140, 517–528 - PubMed
    1. Hamanaka R. B., Chandel N. S. (2009) Curr. Opin. Cell Biol. 21, 894–899 - PMC - PubMed
    1. Landriscina M., Maddalena F., Laudiero G., Esposito F. (2009) Antioxid. Redox Signal. 11, 2701–2716 - PubMed
    1. Novo E., Parola M. (2008) Fibrogenesis Tissue Repair 1, 5. - PMC - PubMed
    1. Tattoli I., Carneiro L. A., Jéhanno M., Magalhaes J. G., Shu Y., Philpott D. J., Arnoult D., Girardin S. E. (2008) EMBO Rep. 9, 293–300 - PMC - PubMed