. 2011 Jan;300(1):E145-54.
doi: 10.1152/ajpendo.00490.2010. Epub 2010 Oct 19.

Free fatty acids in the presence of high glucose amplify monocyte inflammation via Toll-like receptors

Affiliations

Free fatty acids in the presence of high glucose amplify monocyte inflammation via Toll-like receptors

Mohan R Dasu et al. Am J Physiol Endocrinol Metab. 2011 Jan.

Abstract

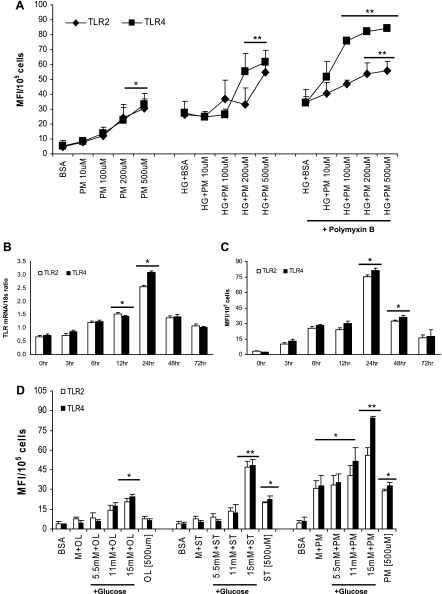
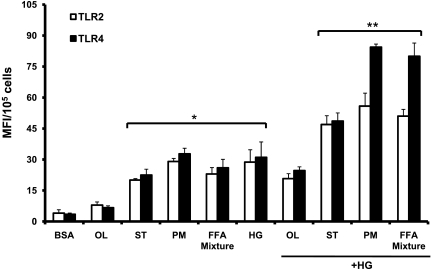
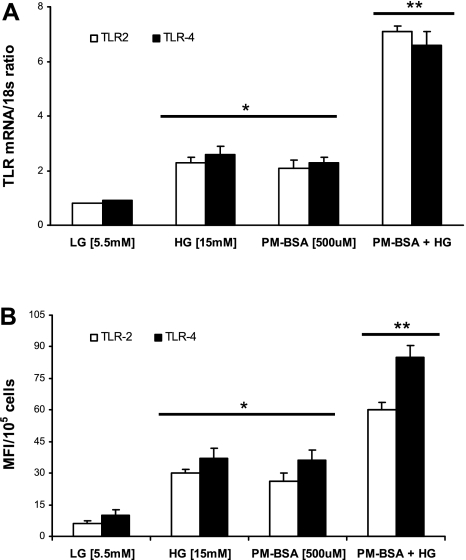
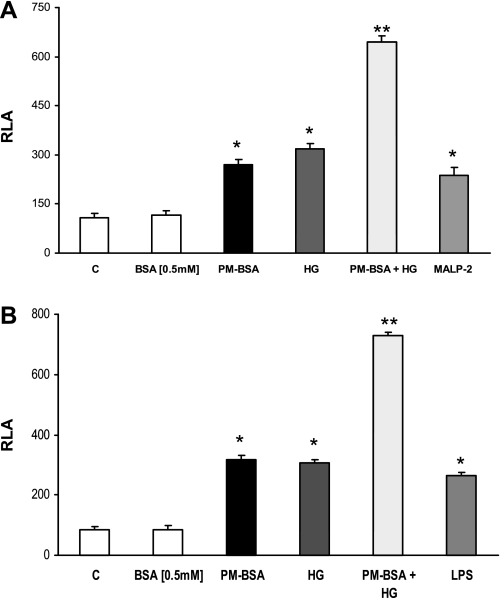
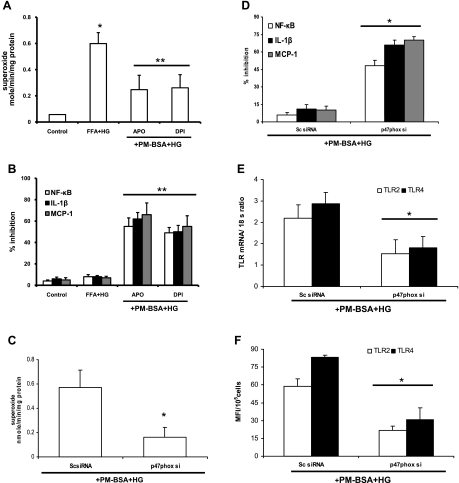
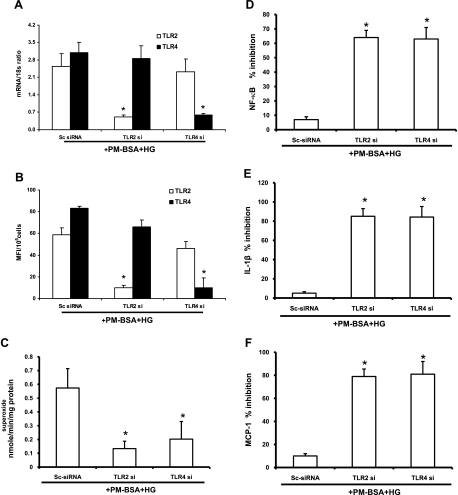
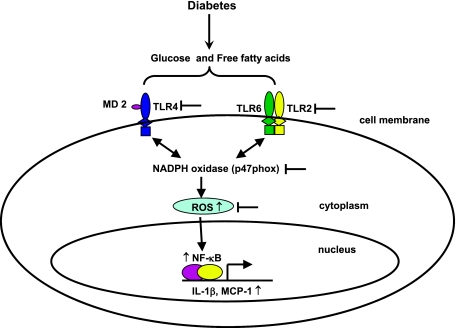
Type 2 diabetes (T2DM) is characterized by hyperglycemia, dyslipidemia, and increased inflammation. Previously, we showed that high glucose (HG) induces Toll-like receptor (TLR) expression, activity, and inflammation via NF-κB followed by cytokine release in vitro and in vivo. Here, we determined how HG-induced inflammation is affected by free fatty acids (FFA) in human monocytes. THP-1 monocytic cells, CD14(+) human monocytes, and transiently transfected HEK293 cells were exposed to various FFA (0-500 μM) and glucose (5-20 mM) for evaluation of TLR2, TLR4, NF-κB, IL-1β, monocyte chemoattractant protein-1 (MCP-1), and superoxide release. In THP-1 cells, palmitate increased cellular TLR2 and TLR4 expression, generated reactive oxygen species (ROS), and increased NF-κB activity, IL-1β, and MCP-1 release in a dose- and time-dependent manner. Similar data were observed with stearate and FFA mixture but not with oleate. Conversely, NADPH oxidase inhibitor treatment repressed glucose- and palmitate-stimulated ROS generation and NF-κB activity and decreased IL-1β and MCP-1 expression. Silencing TLR2, TLR4, and p47phox with small inhibitory RNAs (siRNAs) significantly reduced superoxide release, NF-κB activity, IL-1β, and MCP-1 secretion in HG and palmitate-treated THP-1 cells. Moreover, data from transient transfection experiments suggest that TLR6 is required for TLR2 and MD2 for TLR4 to augment inflammation in FFA- and glucose-exposed cells. These findings were confirmed with human monocytes. We conclude that FFA exacerbates HG-induced TLR expression and activity in monocytic cells with excess superoxide release, enhanced NF-κB activity, and induced proinflammatory factor release.


Figures

Fig. 1.
Fig. 1.
A: dose response of palmitate (PM)-bovine serum albumin (BSA) in high glucose (HG). Toll-like receptor (TLR)2 and TLR4 surface protein expression was measured in THP-1 cells exposed to increasing PM-BSA concentrations in 15 mM glucose for 24 h by flow cytometry as described in materials and methods. Values are expressed as mean fluorescence intensity units (MFI)/105 cells. *P < 0.005 vs. BSA control; **P < 0.05 vs. HG+BSA. B: time course of PM-BSA in HG. TLR2 and TLR4 mRNA expression ratios in THP-1 cells exposed to PM-BSA with 15 mM glucose and treated for indicated times were determined by RT-PCR as described in materials and methods. 18S mRNA was used as the housekeeping gene. Values are expressed as mean ± SD ratio. *P < 0.01 vs. 0 h. C: time course of PM-BSA in HG. TLR2 and TLR4 surface expression in THP-1 cells exposed to PM-BSA with 15 mM glucose and treated for indicated times were determined by flow cytometry as described in materials and methods. Values are means ± SD. *P < 0.05 vs. 0 h. D: dose response of glucose with 3 different free fatty acid (FFA)-BSA complexes. TLR2 and TLR4 surface protein expression was measured in THP-1 cells exposed to 500 μM FFA-BSA complexes with increasing glucose concentrations for 24 h by flow cytometry as described in materials and methods. Values are means ± SD. *P < 0.05 vs. BSA control or mannitol (9.5 mM); **P < 0.05 vs. 5.5 mM+ST/PM OL, oleate; ST, stearate.
Fig. 2.
Fig. 2.
Effect of different FFA-BSA complexes in HG. TLR2 and TLR4 surface protein expression was measured in THP-1 cells exposed to 500 μM FFA-BSA complexes with HG (15 mM) for 24 h by flow cytometry as described in materials and methods. Values are means ± SD. *P < 0.001 vs. BSA control; **P < 0.05 vs. HG.
Fig. 3.
Fig. 3.
Effect of PM-BSA in HG on human monocytes. A: TLR2 and TLR4 mRNA expression ratios in human monocytes exposed to PM-BSA with 15 mM glucose were determined by RT-PCR as described in materials and methods. 18S mRNA was used as the housekeeping gene. Values are expressed as mean ± SD ratio. *P < 0.005, **P < 0.05 vs. HG or PM-BSA. B: TLR2 and TLR4 surface protein expression was measured in human monocytes exposed to 500 μM PM-BSA in 15 mM glucose for 24 h by flow cytometry as described in materials and methods. Values are expressed as means ± SD. *P < 0.05 vs. low glucose (LG); **P < 0.05 vs. HG or PM+BSA.
Fig. 4.
Fig. 4.
Ectopic expression of TLR2, 4, or 6 or MD2 alone in 293T cells confirm the excess responsiveness of PM in HG. A: 293T cells were cotransfected with NF-κB(2x)-luciferase reporter plasmid and the expression plasmid of TLR2 and TLR6 as described in materials and methods. Relative luciferase activity (RLA) was determined by normalization with β-galactosidase activity. Values are means ± SD. *P < 0.05 vs. BSA; **P < 0.01 vs. FFA-BSA or HG. MALP-2, macrophage-activating lipopeptide-2. B: 293T cells were cotransfected with NF-κB(2x)-luciferase reporter plasmid and the expression plasmid of TLR4 and MD2 as described in materials and methods. RLA was determined by normalization with β-galactosidase activity. Values are means ± SD. *P < 0.05 vs. BSA; **P < 0.01 vs. PM-BSA or HG.
Fig. 5.
Fig. 5.
Role of NADPH oxidase. A: effect of NADPH oxidase inhibitors [apocynin (Apo) and diphenyleneiodonium (DPI)] on superoxide release by THP-1 cells. Cells pretreated with inhibitors were exposed to PM-BSA+HG, and superoxide release was measured as described in materials and methods. Values (in nmol·min−1·mg protein−1) are expressed as means ± SD. *P < 0.05 vs. PM-BSA+HG. B: effect of NADPH oxidase inhibitors (apocynin and DPI) on NF-κB activity, IL-1β, and monocyte chemoattractant protein-1 (MCP-1) release by THP-1 cells. Cells pretreated with inhibitors were exposed to PM-BSA+HG, and NF-κB activity, IL-1β, and MCP-1 release were measured as described in materials and methods. Values are expressed as mean ± SD % inhibition of control. **P < 0.01 vs. PM-BSA+HG. C: inhibition of NADPH oxidase subunit p47phox with small inhibitory RNAs (siRNAs) affects PM-BSA+HG-induced superoxide release by THP-1 cells as described in materials and methods. Values (in nmol·min−1·mg protein−1) are expressed as means ± SD. *P < 0.05 vs. scrambled control (Sc)-siRNA. D: inhibition of NADPH oxidase subunit p47phox with siRNAs affects PM-BSA+HG-induced NF-κB activity, IL-1β, and MCP-1 release by THP-1 cells as described in materials and methods. Values are expressed as mean ± SD % inhibition of control. *P < 0.05 vs. Sc-siRNA. E: inhibition of NADPH oxidase subunit p47phox with siRNAs affects PM-BSA+HG-induced TLR2 and TLR4 mRNA expression in THP-1 cells as described in materials and methods. Values are expressed as mean ± SD expressed mRNA/18S. *P < 0.005 vs. Sc-siRNA. F: inhibition of NADPH oxidase subunit p47phox with siRNAs affects PM-BSA+HG-induced TLR2 and TLR4 surface expression in THP-1 cells as described in materials and methods. Values are expressed as means ± SD. *P < 0.05 vs. Sc-siRNA.
Fig. 6.
Fig. 6.
A: inhibition of TLR2 and TLR4 with siRNAs affects PM-BSA+HG-induced TLR2 and TLR4 mRNA expression in THP-1 cells as described in materials and methods. Values are expressed as mean ± SD expressed mRNA/18S. *P < 0.05 vs. Sc-siRNA. B: inhibition of TLR2 and TLR4 with siRNAs affects PM-BSA+HG induced TLR2 and TLR4 surface expression in THP-1 cells as described in materials and methods. Values are expressed as means ± SD. *P < 0.005 vs. Sc-siRNA. C: inhibition of TLR2 and TLR4 with siRNAs affects PM-BSA+HG-induced superoxide release by THP-1 cells as described in materials and methods. Values (in nmol·min−1·mg protein−1) are expressed as means ± SD. *P < 0.02 vs. Sc-siRNA. D: inhibition of TLR2 and TLR4 with siRNAs affects PM-BSA+HG-induced NF-κB activity in THP-1 cells as described in materials and methods. Values are expressed as mean ± SD % inhibition of control. *P < 0.001 vs. Sc-siRNA. E: inhibition of TLR2 and TLR4 with siRNAs affects PM-BSA+HG-induced IL-1β release by THP-1 cells as described in materials and methods. Values are expressed as mean ± SD % inhibition of control. *P < 0.05 vs. Sc-siRNA. F: inhibition of TLR2 and TLR4 with siRNAs affects PM-BSA+HG-induced MCP-1 release by THP-1 cells as described in materials and methods. Values are expressed as mean ± SD % inhibition of control. *P < 0.05 vs. Sc-siRNA.
Fig. 7.
Fig. 7.
Schematic representation of how glucose and palmitate induce TLR activation and inflammation in monocytes. According to the data presented, palmitate in HG amplifies TLR2 and TLR4 expression and function via increased NF-κB activation and cytokine production. In parallel, both HG and palmitate promote production of superoxide via p47phox, which by themselves induce inflammation. Inhibition of TLR expression and NADPH oxidase (p47phox) with siRNA and specific chemical inhibitors significantly attenuates HG- and palmitate-amplified TLR-mediated inflammation in monocytes.

References

    1. Aas V, Rokling-Andersen M, Wensaas AJ, Thoresen GH, Kase ET, Rustan AC. Lipid metabolism in human skeletal muscle cells: effects of palmitate and chronic hyperglycaemia. Acta Physiol Scand 183: 31–41, 2005 - PubMed
    1. Ajuwon KM, Spurlock ME. Palmitate activates the NF-kappaB transcription factor and induces IL-6 and TNFalpha expression in 3T3-L1 adipocytes. J Nutr 135: 1841–1846, 2005 - PubMed
    1. Böni-Schnetzler M, Boller S, Debray S, Bouzakri K, Meier DT, Prazak R, Kerr-Conte J, Pattou F, Ehses JA, Schuit FC, Donath MY. Free fatty acids induce a proinflammatory response in islets via the abundantly expressed interleukin-1 receptor I. Endocrinology 150: 5218–5229, 2009 - PubMed
    1. Caricilli AM, Nascimento PH, Pauli JR, Tsukumo DM, Velloso LA, Carvalheira JB. Inhibition of toll-like receptor 2 expression improves insulin sensitivity and signaling in muscle and white adipose tissue of mice fed a high-fat diet. J Endocrinol 199: 399–406, 2008 - PubMed
    1. Chait A, Bornfeldt KE. Diabetes and atherosclerosis: is there a role for hyperglycemia? J Lipid Res 50, Suppl: S335–S339, 2009 - PMC - PubMed

Publication types

MeSH terms