. 2010 Oct 5:6:420.
doi: 10.1038/msb.2010.77.

Epistatic relationships reveal the functional organization of yeast transcription factors

Affiliations

Epistatic relationships reveal the functional organization of yeast transcription factors

Jiashun Zheng et al. Mol Syst Biol. .

Abstract

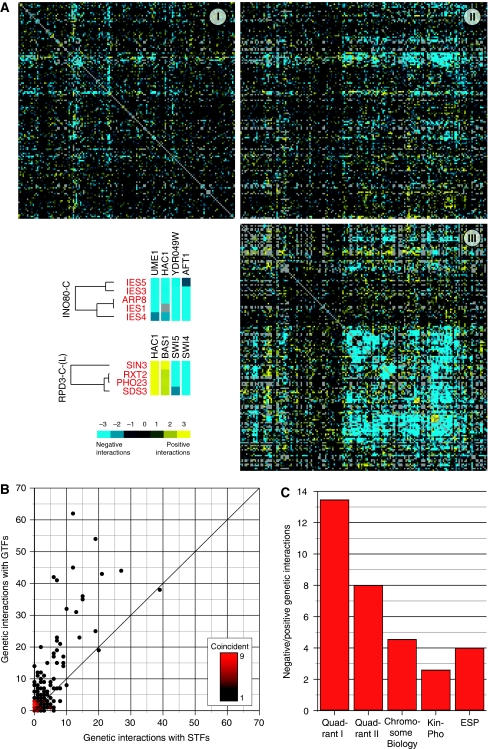
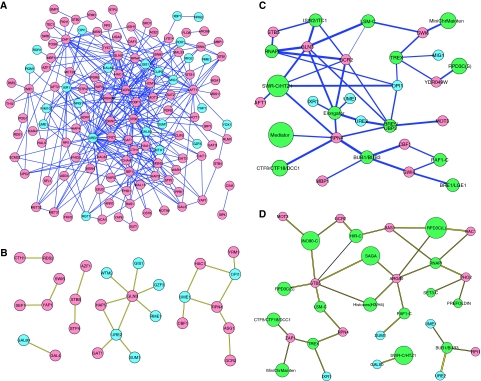
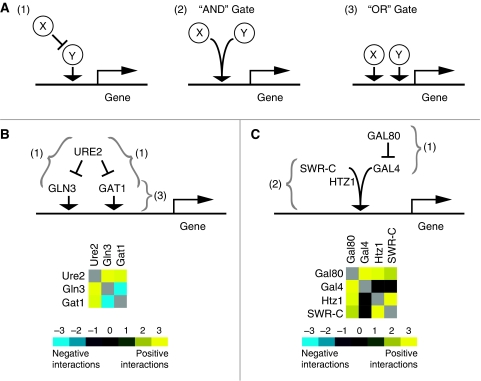
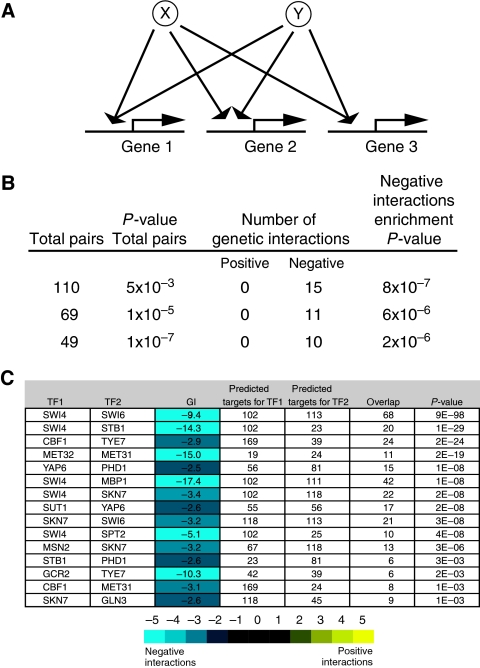
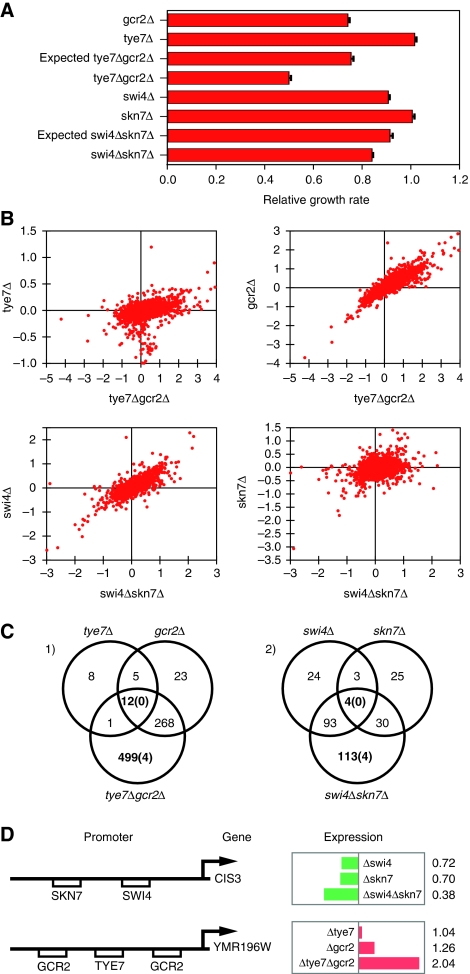
The regulation of gene expression is, in large part, mediated by interplay between the general transcription factors (GTFs) that function to bring about the expression of many genes and site-specific DNA-binding transcription factors (STFs). Here, quantitative genetic profiling using the epistatic miniarray profile (E-MAP) approach allowed us to measure 48 391 pairwise genetic interactions, both negative (aggravating) and positive (alleviating), between and among genes encoding STFs and GTFs in Saccharomyces cerevisiae. This allowed us to both reconstruct regulatory models for specific subsets of transcription factors and identify global epistatic patterns. Overall, there was a much stronger preference for negative relative to positive genetic interactions among STFs than there was among GTFs. Negative genetic interactions, which often identify factors working in non-essential, redundant pathways, were also enriched for pairs of STFs that co-regulate similar sets of genes. Microarray analysis demonstrated that pairs of STFs that display negative genetic interactions regulate gene expression in an independent rather than coordinated manner. Collectively, these data suggest that parallel/compensating relationships between regulators, rather than linear pathways, often characterize transcriptional circuits.


Conflict of interest statement

The authors declare that they have no conflict of interest.

Figures

Figure 1
Figure 1
Site-specific and general transcription factors evoke distinct patterns of epistasis. (A) Genes were segregated into site-specific (STF) or general (GTF) transcription factor classes and clustered based on their quantitative epistatic interaction profiles. Quadrants I, II, and III represent the STF–STF, STF–GTF, and GTF–GTF classes, respectively. The intensity of yellow and blue indicates the strength of positive and negative interactions, respectively. Individual interactions between components of the INO80-C and RPD3-C-(L) chromatin remodeling complexes and selected STFs are shown (bottom left). (B) A density plot shows a preference for STFs to display significant genetic interactions with GTFs compared with other STFs. Each point on the plot represents a single STF or groups of STFs with identical interaction frequency. (C) The ratio of negative (S-score⩽−2.5) to positive interactions (S-score ⩾2.5) for the set of genes in quadrant I is significantly greater (P=0.0068) than that for quadrant II and even more significant when compared with the data from E-MAPs focusing on the early secretory pathway (ESP) (Schuldiner et al, 2005) (P<10−10), chromosome biology (Collins et al, 2007) (P<10−8), and signaling (Fiedler et al, 2009) (P<10−20).
Figure 2
Figure 2
Network representation of genetic interactions between and among STFs and GTFs. STFs linked to each other by negative (A) or positive (B) interactions, and to GTF complexes by negative (C) or positive (D) interactions are shown. Red, blue, and green shading indicate activating and repressing gene products, or GTF protein complexes, respectively. The sizes of the green nodes corresponding to the GTFs correlate with the number of components of the complex that were genetically analyzed. The thickness of the line corresponds to the strength of the interaction. See http://interactome-cmp.ucsf.edu for a list of all interactions. Source data is available for this figure at www.nature.com/msb.
Figure 3
Figure 3
Epistatic patterns underlie local regulatory architectures. Three alternative regulatory modules involving a pair of gene products (X and Y) are shown in (A), where X represses the activator Y (1), X and Y cooperate to activate gene expression (2), and X and Y act in parallel/redundantly (3). In the simplified language of Boolean logic, these are indicated by ‘AND’ and ‘OR’ relationships. Examples of these behaviors involving regulation of nitrogen catabolism (B) and galactose metabolism (C) are shown. See text for a detailed interpretation of the individual interactions.
Figure 4
Figure 4
STFs that regulate similar sets of genes display negative genetic interactions. The number of occurrences of such architectures (A) are tabulated (B), and specific examples indicated (C). (B) Using previously reported target predictions (MacIsaac et al, 2006) from ChIP-chip data (Harbison et al, 2004), three different P-value thresholds (0.005, 10−5, and 10−7) (based on significant target overlap) were applied for each pair of transcription factors. The number of significantly negative (⩽−2.5) and positive (⩾2.5) genetic interactions, as well as the statistical enrichment for negative interactions, is listed for each set. (C) The 15 pairs of STFs that shared a significant overlap of target genes (0.005) and displayed negative genetic interactions are tabulated.
Figure 5
Figure 5
(A) Relative growth rate measured from liquid growth confirmed the negative interactions of swi4-skn7 and gcr2-tye7. (B) Gene expression of double-deletion strains show better correlations with the single-deletion strains with more severe growth defect (Log2 fold change values compared with wild-type were plotted). (C) The number of genes with expression level changed significantly in double mutants and corresponding single mutants. The numbers in the parenthesis indicated the number of common target genes within the corresponding set of genes. (D) Examples of genes regulated by two transcription factors with an ‘OR’ gate. The left panel shows the promoters with TF-binding sites indicated by the boxes. The right panel shows gene expression change in the single and double mutants. The numbers indicate expression level relative to the wild type. Length of the bar is proportion to the difference between the mutant and wild type. Green bars indicate that the expression levels of the corresponding genes are lower than the wild type, whereas red bars indicate higher gene expression levels.

References

    1. Adam M, Robert F, Larochelle M, Gaudreau L (2001) H2A.Z is required for global chromatin integrity and for recruitment of RNA polymerase II under specific conditions. Mol Cell Biol 21: 6270–6279 - PMC - PubMed
    1. Aguilar PS, Frohlich F, Rehman M, Shales M, Ulitsky I, Olivera-Couto A, Braberg H, Shamir R, Walter P, Mann M, Ejsing CS, Krogan NJ, Walther TC (2010) A plasma-membrane E-MAP reveals links of the eisosome with sphingolipid metabolism and endosomal trafficking. Nat Struct Mol Biol 17: 901–908 - PMC - PubMed
    1. Badis G, Berger MF, Philippakis AA, Talukder S, Gehrke AR, Jaeger SA, Chan ET, Metzler G, Vedenko A, Chen X, Kuznetsov H, Wang CF, Coburn D, Newburger DE, Morris Q, Hughes TR, Bulyk ML (2009) Diversity and complexity in DNA recognition by transcription factors. Science 324: 1720–1723 - PMC - PubMed
    1. Badis G, Chan ET, van Bakel H, Pena-Castillo L, Tillo D, Tsui K, Carlson CD, Gossett AJ, Hasinoff MJ, Warren CL, Gebbia M, Talukder S, Yang A, Mnaimneh S, Terterov D, Coburn D, Yeo AL, Yeo ZX, Clarke ND, Lieb JD et al. (2008) A library of yeast transcription factor motifs reveals a widespread function for Rsc3 in targeting nucleosome exclusion at promoters. Mol Cell 32: 878–887 - PMC - PubMed
    1. Beltrao P, Cagney G, Krogan NJ (2010) Quantitative genetic interactions reveal biological modularity. Cell 141: 739–745 - PMC - PubMed

Publication types

MeSH terms

Substances