

Tumor response and progression-free survival as potential surrogate endpoints for overall survival in extensive stage small-cell lung cancer: findings on the basis of North Central Cancer Treatment Group trials
- PMID: 20960500
- PMCID: PMC3025267
- DOI: 10.1002/cncr.25526
Tumor response and progression-free survival as potential surrogate endpoints for overall survival in extensive stage small-cell lung cancer: findings on the basis of North Central Cancer Treatment Group trials
Abstract
Background: The authors investigated the putative surrogate endpoints of best response, complete response (CR), confirmed response, and progression-free survival (PFS) for associations with overall survival (OS), and as possible surrogate endpoints for OS.
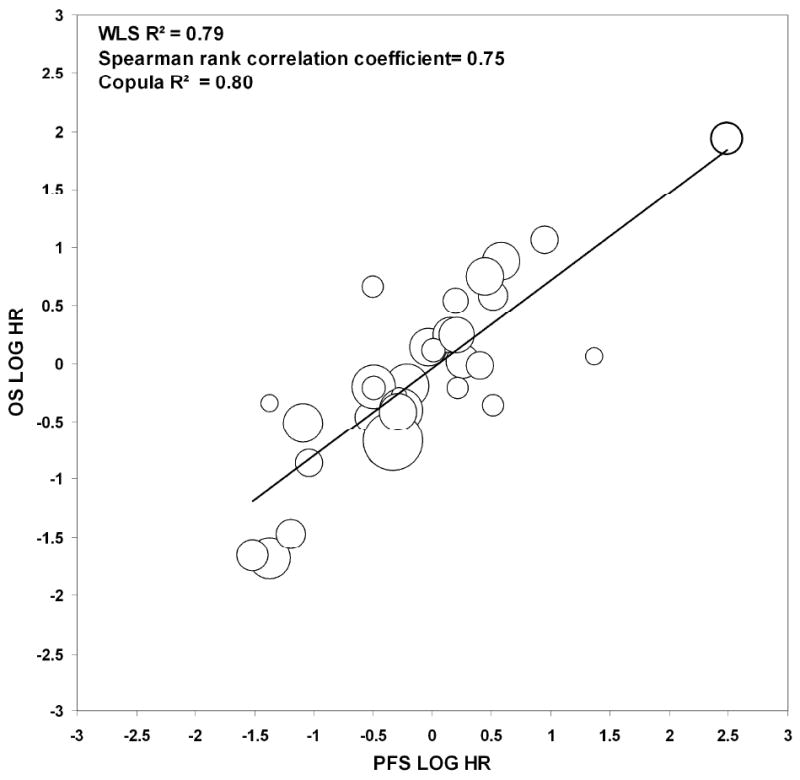
Methods: Individual patient data from 870 untreated extensive stage small-cell lung cancer patients participating in 6 single-arm (274 patients) and 3 randomized trials (596 patients) were pooled. Patient-level associations between putative surrogate endpoints and OS were assessed by Cox models using landmark analyses. Trial-level surrogacy of putative surrogate endpoints were assessed by the association of treatment effects on OS and individual putative surrogate endpoints. Trial-level surrogacy measures included: R(2) from weighted least squares regression model, Spearman correlation coefficient, and R(2) from bivariate survival model (Copula R(2) ).
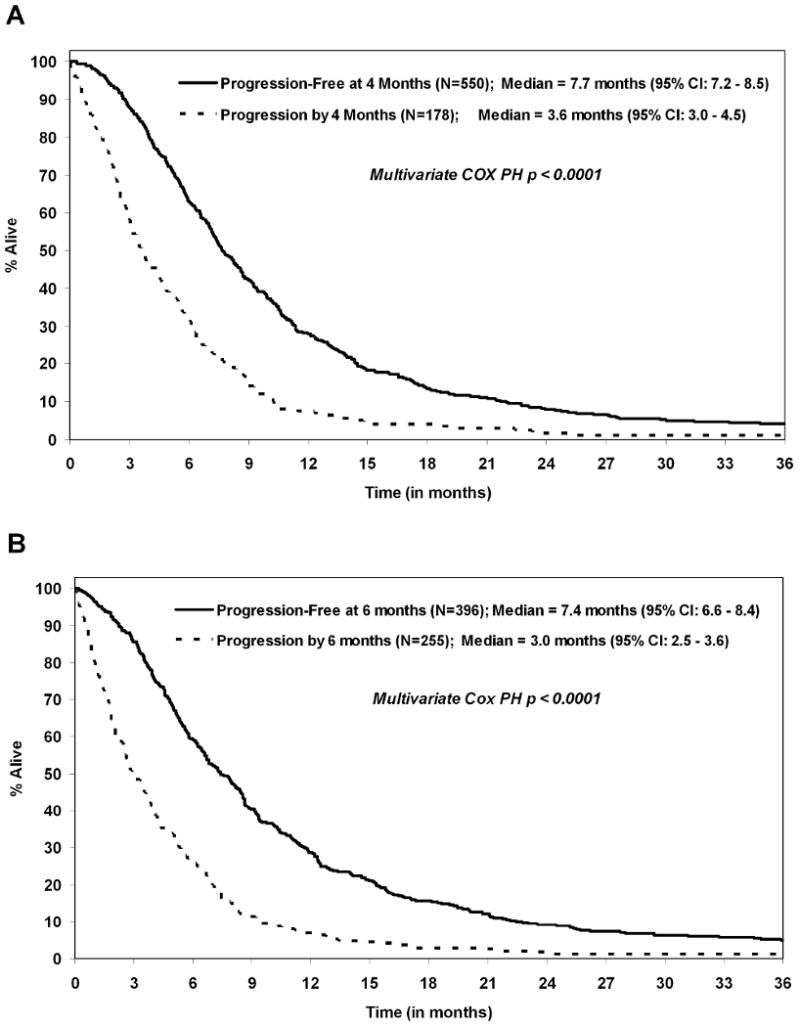
Results: Median OS and PFS were 9.6 (95% confidence interval [CI], 9.1-10.0) and 5.5 (95% CI, 5.2-5.9) months, respectively; best response, CR, and confirmed response rates were 44%, 22%, and 34%, respectively. Patient-level associations showed that PFS status at 4 months was a strong predictor of subsequent survival (hazard ratio [HR], 0.42; 95% CI, 0.35-0.51; concordance index 0.63; P < .01), with 6-month PFS being the strongest (HR, 0.41; 95% CI, 0.35-0.49; concordance index, 0.66, P < .01). At the trial level, PFS showed the highest level of surrogacy for OS (weighted least squares R(2) = 0.79; Copula R(2) = 0.80), explaining 79% of the variance in OS. Tumor response endpoints showed lower surrogacy levels (weighted least squares R(2) ≤0.48).
Conclusions: PFS was strongly associated with OS at both the patient and trial levels. PFS also shows promise as a potential surrogate for OS, but further validation is needed using data from a larger number of randomized phase 3 trials.
Copyright © 2010 American Cancer Society.
Figures

References
-
- Jemal A, Siegel R, Ward E, Hao Y, Xu J, Thun MJ. Cancer statistics, 2009. CA Cancer J Clin. 2009;59(4):225–49. - PubMed
-
- Horner MJ, Ries LAG, Krapcho M, et al. National Cancer Institute; Bethesda, MD: SEER Cancer Statistics Review, 1975-2006. http://seer.cancer.gov/csr/1975_2006/, based on November 2008 SEER data submission, posted to the SEER web site, 2009.
-
- National Cancer Institute, U.S. National Institutes of Health. small-cell lung cancer for health professionals. [March 2010]. website on. Available at http://www.cancer.gov/cancertopics/pdq/treatment/small-cell-lung/healthp....
-
- Socinski MA, Smit EF, Lorigan P, et al. Phase III study of pemetrexed plus carboplatin compared with etoposide plus carboplatin in chemotherapy-naive patients with extensive-stage small-cell lung cancer. J Clin Oncol. 2009;27(28):4787–92. - PubMed
Publication types
MeSH terms
Substances
Grants and funding
LinkOut - more resources
Full Text Sources
Medical
