Comparative Study
. 2010 Oct 21:10:21.
doi: 10.1186/1472-6793-10-21.

Diet-induced obesity in zebrafish shares common pathophysiological pathways with mammalian obesity

Affiliations
Comparative Study

Diet-induced obesity in zebrafish shares common pathophysiological pathways with mammalian obesity

Takehiko Oka et al. BMC Physiol. .

Abstract

Background: Obesity is a multifactorial disorder influenced by genetic and environmental factors. Animal models of obesity are required to help us understand the signaling pathways underlying this condition. Zebrafish possess many structural and functional similarities with humans and have been used to model various human diseases, including a genetic model of obesity. The purpose of this study was to establish a zebrafish model of diet-induced obesity (DIO).

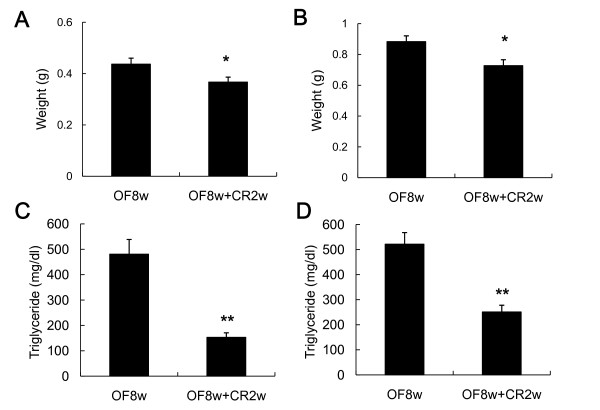
Results: Zebrafish were assigned into two dietary groups. One group of zebrafish was overfed with Artemia (60 mg dry weight/day/fish), a living prey consisting of a relatively high amount of fat. The other group of zebrafish was fed with Artemia sufficient to meet their energy requirements (5 mg dry weight/day/fish). Zebrafish were fed under these dietary protocols for 8 weeks. The zebrafish overfed with Artemia exhibited increased body mass index, which was calculated by dividing the body weight by the square of the body length, hypertriglyceridemia and hepatosteatosis, unlike the control zebrafish. Calorie restriction for 2 weeks was applied to zebrafish after the 8-week overfeeding period. The increased body weight and plasma triglyceride level were improved by calorie restriction. We also performed comparative transcriptome analysis of visceral adipose tissue from DIO zebrafish, DIO rats, DIO mice and obese humans. This analysis revealed that obese zebrafish and mammals share common pathophysiological pathways related to the coagulation cascade and lipid metabolism. Furthermore, several regulators were identified in zebrafish and mammals, including APOH, IL-6 and IL-1β in the coagulation cascade, and SREBF1, PPARα/γ, NR1H3 and LEP in lipid metabolism.

Conclusion: We established a zebrafish model of DIO that shared common pathophysiological pathways with mammalian obesity. The DIO zebrafish can be used to identify putative pharmacological targets and to test novel drugs for the treatment of human obesity.


Figures

Figure 1
Figure 1
Assessment of BMI, plasma TG and hepatic steatosis in zebrafish overfed with Artemia. Changes in BMI (g/cm2) in male (A) and female (B) zebrafish in the control and OF groups. Values are means ± SEM. OF group: n = 17 males and 16 females. Control group: n = 14 males and 17 females. Changes in plasma TG levels in male (C) and female (D) zebrafish in the control and OF groups. Values are means ± SEM. OF group: n = 7 males and 8 females. Control group: n = 7 males and 9 females. Statistical analyses were performed using Student's t-test to compare the OF and control groups at each time-point. *P < 0.05, **P < 0.01. (E-H) Oil Red O staining of liver sections from a male (E) and female (F) in the control group and a male (G) and female (H) in the OF group.
Figure 2
Figure 2
Effects of calorie restriction on body weight and plasma TG level. Body weight is significantly decreased by CR for 2 weeks in both male (A) and female (B) zebrafish. Values are means ± SEM. n = 7 for each group. The plasma TG level is significantly decreased by 2 weeks of CR in male (C) and female (D) zebrafish. Values are means ± SEM. n = 7 for each group. Statistical analyses were performed using Student's t-test to compare the OF8W and the OF8W+CR2W groups. *P < 0.05, **P < 0.01.
Figure 3
Figure 3
Network for the coagulation cascade. The network shows direct interactions between the three key regulatory molecules (IL-6, IL-1β and APOH, shown in yellow) identified by SNEA (Table 3) and their target genes in the coagulation cascade (blood coagulation and platelet activation) identified by GSEA (Table 2). Red and green denote genes with increased and decreased expression, respectively, in obese (OF8W) compared with control (OF1W) zebrafish. Gray denotes genes that were not spotted in the microarray. To reduce the complexity, the rat, mouse and human networks were constructed using the three regulatory factors and their target genes that were spotted in Agilent Zebrafish Oligoarray. A. zebrafish DIO (GSE18566), B. rat DIO (GSE8700), C. mouse DIO (GSE11790), D. human obesity (GSE15524).
Figure 4
Figure 4
Network for lipid metabolic pathways. The network shows direct interactions between the five key regulatory molecules (SREBP1, PPARα/γ, NR3H1 and LEP, shown in yellow) identified by SNEA (Table 3) and their target genes involved in the lipid metabolic pathways (fatty acid metabolism, cholesterol efflux and triglyceride metabolism) identified by GSEA (Table 2). Red and green denote genes with increased and decreased expression, respectively, in obese (OF8W) compared with control (OF1W) zebrafish. Gray denotes genes that were not spotted in the microarray. To reduce the complexity, the rat, mouse and human networks were constructed using the five regulatory factors and their target genes that were spotted in the Agilent Zebrafish Oligoarray. A. zebrafish DIO (GSE18566), B. rat DIO (GSE8700), C. mouse DIO (GSE11790), D. human obesity (GSE15524).
Figure 5
Figure 5
Effects of CR on the coagulation cascade and lipid metabolism in DIO zebrafish. A. Network showing direct interactions between the three key regulatory molecules (IL-6, IL-1β and APOH, shown in yellow) identified by SNEA (Table 3) and their target genes in the coagulation cascade (blood coagulation and platelet activation) identified by GSEA (Table 2). B. Network showing direct interactions between the five key regulatory molecules (SREBP1, PPARα/γ, NR3H1 and LEP, shown in yellow) identified by SNEA (Table 3) and their target genes involved in the lipid metabolic pathways (fatty acid metabolism, cholesterol efflux and triglyceride metabolism) identified by GSEA (Table 2). Red and green denote genes with increased and decreased expression, respectively, at CR2W compared with OF1W. Gray denotes genes that were not spotted in the microarray.

References

    1. Bessesen DH. Update on obesity. J Clin Endocrinol Metab. 2008;93(6):2027–2034. doi: 10.1210/jc.2008-0520. - DOI - PubMed
    1. Bell CG, Walley AJ, Froguel P. The genetics of human obesity. Nat Rev Genet. 2005;6(3):221–234. doi: 10.1038/nrg1556. - DOI - PubMed
    1. Adan RA, Vanderschuren LJ, ElF S. Anti-obesity drugs and neural circuits of feeding. Trends Pharmacol Sci. 2008;29(4):208–217. doi: 10.1016/j.tips.2008.01.008. - DOI - PubMed
    1. Speakman JR. Obesity: the integrated roles of environment and genetics. J Nutr. 2004;134(8 Suppl):2090S–2105S. - PubMed
    1. Rankinen T, Zuberi A, Chagnon YC, Weisnagel SJ, Argyropoulos G, Walts B, Perusse L, Bouchard C. The human obesity gene map: the 2005 update. Obesity (Silver Spring) 2006;14(4):529–644. doi: 10.1038/oby.2006.71. - DOI - PubMed

Publication types