

The identification of HLA class II-restricted T cell epitopes to vaccinia virus membrane proteins
- PMID: 20961593
- PMCID: PMC2975829
- DOI: 10.1016/j.virol.2010.09.013
The identification of HLA class II-restricted T cell epitopes to vaccinia virus membrane proteins
Abstract
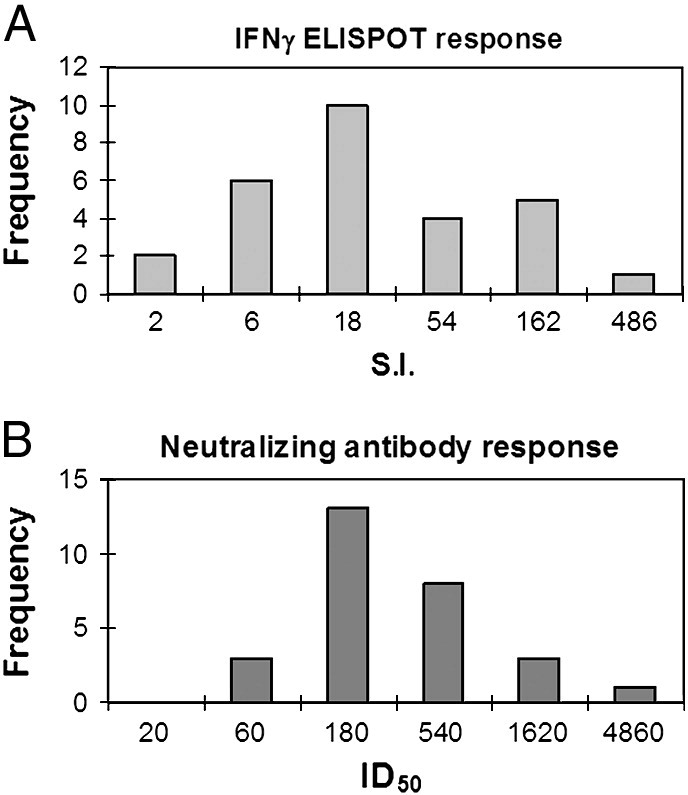
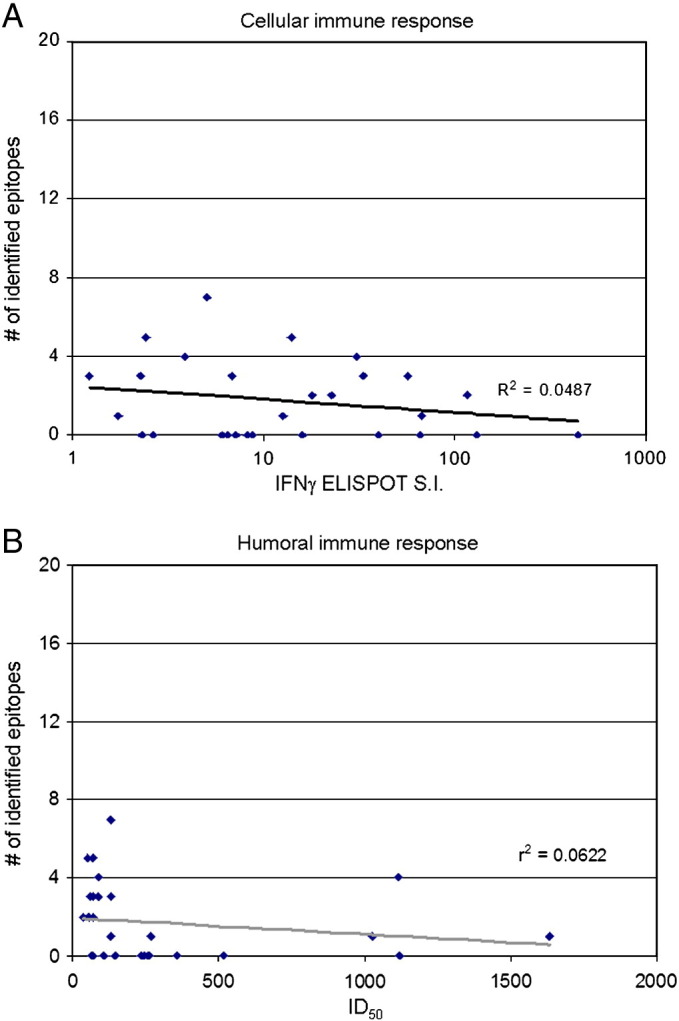
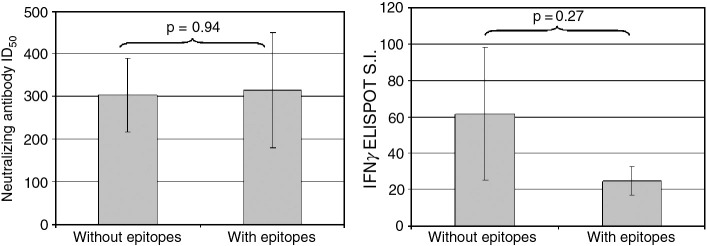
Three decades after the eradication of smallpox, the threat of bioterrorism and outbreaks of emerging diseases such as monkeypox have renewed interest in the development of safe and effective next-generation poxvirus vaccines and biodefense research. Current smallpox vaccines contain live virus and are contraindicated for a large percentage of the population. Safer, yet still effective inactivated and subunit vaccines are needed, and epitope identification is an essential step in the development of these subunit vaccines. In this study we focused on 4 vaccinia membrane proteins known to be targeted by humoral responses in vaccinees. In spite of the narrow focus of the study we identified 36T cell epitopes, and provide additional support for the physical linkage between T and B epitopes. This information may prove useful in peptide and protein-based subunit vaccine development as well as in the study of CD4 responses to poxviruses.
Copyright © 2010 Elsevier Inc. All rights reserved.
Figures
Similar articles
-
Vaccination of BALB/c mice with Escherichia coli-expressed vaccinia virus proteins A27L, B5R, and D8L protects mice from lethal vaccinia virus challenge.J Virol. 2008 Apr;82(7):3517-29. doi: 10.1128/JVI.01854-07. Epub 2008 Jan 16. J Virol. 2008. PMID: 18199639 Free PMC article.
-
T-Cell epitope discovery for variola and vaccinia viruses.Rev Med Virol. 2007 Mar-Apr;17(2):93-113. doi: 10.1002/rmv.527. Rev Med Virol. 2007. PMID: 17195963 Review.
-
Human cytotoxic CD4+ T cells recognize HLA-DR1-restricted epitopes on vaccinia virus proteins A24R and D1R conserved among poxviruses.J Immunol. 2007 Jul 15;179(2):1303-12. doi: 10.4049/jimmunol.179.2.1303. J Immunol. 2007. PMID: 17617623
-
Identification of vaccinia CD8+ T-cell epitopes conserved among vaccinia and variola viruses restricted by common MHC class I molecules, HLA-A2 or HLA-B7.Hum Immunol. 2006 Jul;67(7):512-20. doi: 10.1016/j.humimm.2005.12.004. Epub 2006 May 4. Hum Immunol. 2006. PMID: 16829305
-
The immunology of smallpox vaccines.Curr Opin Immunol. 2009 Jun;21(3):314-20. doi: 10.1016/j.coi.2009.04.004. Epub 2009 Jun 11. Curr Opin Immunol. 2009. PMID: 19524427 Free PMC article. Review.
Cited by
-
Better Epitope Discovery, Precision Immune Engineering, and Accelerated Vaccine Design Using Immunoinformatics Tools.Front Immunol. 2020 Apr 7;11:442. doi: 10.3389/fimmu.2020.00442. eCollection 2020. Front Immunol. 2020. PMID: 32318055 Free PMC article. Review.
-
CD4+ T cells provide intermolecular help to generate robust antibody responses in vaccinia virus-vaccinated humans.J Immunol. 2013 Jun 15;190(12):6023-33. doi: 10.4049/jimmunol.1202523. Epub 2013 May 10. J Immunol. 2013. PMID: 23667112 Free PMC article.
-
The prospective outcome of the monkeypox outbreak in 2022 and characterization of monkeypox disease immunobiology.Front Cell Infect Microbiol. 2023 Jul 18;13:1196699. doi: 10.3389/fcimb.2023.1196699. eCollection 2023. Front Cell Infect Microbiol. 2023. PMID: 37533932 Free PMC article.
-
CD4 T-cell memory responses to viral infections of humans show pronounced immunodominance independent of duration or viral persistence.J Virol. 2013 Mar;87(5):2617-27. doi: 10.1128/JVI.03047-12. Epub 2012 Dec 19. J Virol. 2013. PMID: 23255792 Free PMC article.
-
GM-CSF production allows the identification of immunoprevalent antigens recognized by human CD4+ T cells following smallpox vaccination.PLoS One. 2011;6(9):e24091. doi: 10.1371/journal.pone.0024091. Epub 2011 Sep 9. PLoS One. 2011. PMID: 21931646 Free PMC article.
References
-
- Adamopoulou E., Diekmann J., Tolosa E., Kuntz G., Einsele H., Rammensee H.G., Topp M.S. Human CD4+ T cells displaying viral epitopes elicit a functional virus-specific memory CD8+ T cell response. J. Immunol. 2007;178(9):5465–5472. - PubMed
-
- Artenstein A.W. New generation smallpox vaccines: a review of preclinical and clinical data. Rev. Med. Virol. 2008;18(4):217–231. - PubMed
-
- Bell E., Shamim M., Whitbeck J.C., Sfyroera G., Lambris J.D., Isaacs S.N. Antibodies against the extracellular enveloped virus B5R protein are mainly responsible for the EEV neutralizing capacity of vaccinia immune globulin. Virology. 2004;325(2):425–431. - PubMed
-
- Bernard A., Coitot S., Bremont A., Bernard G. T and B cell cooperation: a dance of life and death. Transplantation. 2005;79(3 Suppl):S8–S11. - PubMed
-
- Bishop G.A., Hostager B.S. B lymphocyte activation by contact-mediated interactions with T lymphocytes. Curr. Opin. Immunol. 2001;13(3):278–285. - PubMed
Publication types
MeSH terms
Substances
Grants and funding
LinkOut - more resources
Full Text Sources
Other Literature Sources
Molecular Biology Databases
Research Materials
