

Activation of p53 enhances apoptosis and insulin resistance in a rat model of alcoholic liver disease
- PMID: 20961644
- PMCID: PMC2994971
- DOI: 10.1016/j.jhep.2010.08.007
Activation of p53 enhances apoptosis and insulin resistance in a rat model of alcoholic liver disease
Abstract
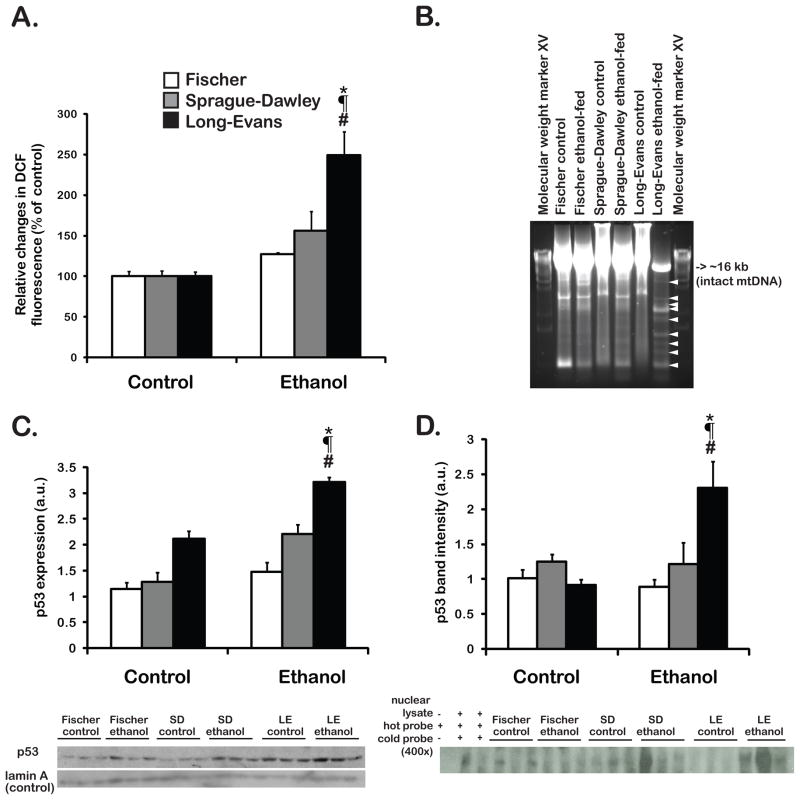
Background & aims: Chronic ethanol consumption in the Long-Evans (LE) rat has been associated with hepatic p53 activation, and inhibition of the insulin/PI3K/AKT signal transduction cascade due to increased expression of PTEN. We hypothesize that p53 activation and altered insulin signaling may influence the susceptibility of rats to ethanol-induced liver damage. Furthermore, p53 not only activates programmed cell death pathways and suppresses hepatocellular survival signals, but also promotes gluconeogenesis to increase systemic insulin resistance due to a novel metabolic function.
Methods: Fischer (F), Sprague-Dawley (SD) and LE rats were fed ethanol-containing or control liquid diet for 8 weeks. Histopathological and biochemical changes were assessed.
Results: Here, we demonstrate that chronic ethanol feeding in rats promotes p53 activation, hepatic steatosis, oxidative stress, PUMA, and PTEN expression, which contribute to hepatocellular death and diminished insulin signaling in the liver. Such changes are pronounced in the LE, less prominent in SD, and virtually absent in the F rat strain. More importantly, there is activation of Tp53-induced glycolysis and apoptosis regulator (TIGAR) in the ethanol-fed LE rat. This event generates low hepatic fructose-2,6-bisphosphate (Fru-2,6-P₂) levels, reduced lactate/pyruvate ratio and may contribute to increased basal glucose turnover and high residual hepatic glucose production during euglycemic hyperinsulinemic clamp.
Conclusions: p53 activation correlates with the susceptibility to ethanol-induced liver damage in different rat strains. p53 not only orchestrates apoptosis and suppresses cell survival, but by activating TIGAR and decreasing hepatic Fru-2,6-P₂) levels it promotes insulin resistance and therefore, contributes to the metabolic abnormalities associated with hepatic steatosis.
Copyright © 2010 European Association for the Study of the Liver. Published by Elsevier B.V. All rights reserved.
Figures


Similar articles
-
Liver-Specific Deletion of Phosphatase and Tensin Homolog Deleted on Chromosome 10 Significantly Ameliorates Chronic EtOH-Induced Increases in Hepatocellular Damage.PLoS One. 2016 Apr 28;11(4):e0154152. doi: 10.1371/journal.pone.0154152. eCollection 2016. PLoS One. 2016. PMID: 27124661 Free PMC article.
-
Early growth response-1 transcription factor promotes hepatic fibrosis and steatosis in long-term ethanol-fed Long-Evans rats.Liver Int. 2012 May;32(5):761-70. doi: 10.1111/j.1478-3231.2012.02752.x. Epub 2012 Jan 31. Liver Int. 2012. PMID: 22292946 Free PMC article.
-
Increased carbonylation of the lipid phosphatase PTEN contributes to Akt2 activation in a murine model of early alcohol-induced steatosis.Free Radic Biol Med. 2013 Dec;65:680-692. doi: 10.1016/j.freeradbiomed.2013.07.011. Epub 2013 Jul 17. Free Radic Biol Med. 2013. PMID: 23872024 Free PMC article.
-
Alcohol, insulin resistance and the liver-brain axis.J Gastroenterol Hepatol. 2012 Mar;27 Suppl 2(0 2):33-41. doi: 10.1111/j.1440-1746.2011.07023.x. J Gastroenterol Hepatol. 2012. PMID: 22320914 Free PMC article. Review.
-
p53 as a Dichotomous Regulator of Liver Disease: The Dose Makes the Medicine.Int J Mol Sci. 2018 Mar 20;19(3):921. doi: 10.3390/ijms19030921. Int J Mol Sci. 2018. PMID: 29558460 Free PMC article. Review.
Cited by
-
Inhibition of p53 attenuates steatosis and liver injury in a mouse model of non-alcoholic fatty liver disease.J Hepatol. 2013 Apr;58(4):785-91. doi: 10.1016/j.jhep.2012.11.042. Epub 2012 Dec 2. J Hepatol. 2013. PMID: 23211317 Free PMC article.
-
Tobacco Smoke-Induced Hepatic Injury with Steatosis, Inflammation, and Impairments in Insulin and Insulin-Like Growth Factor Signaling.J Clin Exp Pathol. 2016 Apr;6(2):269. doi: 10.4172/2161-0681.1000269. Epub 2016 Apr 17. J Clin Exp Pathol. 2016. PMID: 27525191 Free PMC article.
-
Amelioration of ethanol-induced oxidative stress and alcoholic liver disease by in vivo RNAi targeting Cyp2e1.Acta Pharm Sin B. 2023 Sep;13(9):3906-3918. doi: 10.1016/j.apsb.2023.01.009. Epub 2023 Feb 24. Acta Pharm Sin B. 2023. PMID: 37719371 Free PMC article.
-
Sphingolipids and the link between alcohol and cancer.Chem Biol Interact. 2020 May 1;322:109058. doi: 10.1016/j.cbi.2020.109058. Epub 2020 Mar 11. Chem Biol Interact. 2020. PMID: 32171848 Free PMC article. Review.
-
Iron Deprivation May Enhance Insulin Receptor and Glut4 Transcription in Skeletal Muscle of Adult Rats.J Nutr Health Aging. 2015 Oct;19(8):846-54. doi: 10.1007/s12603-015-0541-9. J Nutr Health Aging. 2015. PMID: 26412289
References
-
- Tsukamoto H. Conceptual importance of identifying alcoholic liver disease as a lifestyle disease. J Gastroenterol. 2007;42:603–609. - PubMed
-
- Wilfred de Alwis NM, Day CP. Genetics of alcoholic liver disease and nonalcoholic fatty liver disease. Semin Liver Dis. 2007;27:44–54. - PubMed
-
- Yeon JE, Califano S, Xu J, Wands JR, De La Monte SM. Potential role of PTEN phosphatase in ethanol-impaired survival signaling in the liver. Hepatology. 2003;38:703–714. - PubMed
-
- Stambolic V, MacPherson D, Sas D, Lin Y, Snow B, Jang Y, et al. Regulation of PTEN transcription by p53. Mol Cell. 2001;8:317–325. - PubMed
Publication types
MeSH terms
Substances
Grants and funding
- R37 AA011431/AA/NIAAA NIH HHS/United States
- R01 AA011290/AA/NIAAA NIH HHS/United States
- R37 AA011290/AA/NIAAA NIH HHS/United States
- R01 AA012908/AA/NIAAA NIH HHS/United States
- R56 AA011431/AA/NIAAA NIH HHS/United States
- R01 AA008169/AA/NIAAA NIH HHS/United States
- AA012908/AA/NIAAA NIH HHS/United States
- R01 AA002666/AA/NIAAA NIH HHS/United States
- AA008169/AA/NIAAA NIH HHS/United States
- R37 AA002666/AA/NIAAA NIH HHS/United States
- R01 AA011431/AA/NIAAA NIH HHS/United States
- AA11290/AA/NIAAA NIH HHS/United States
- AA002666/AA/NIAAA NIH HHS/United States
- AA011431/AA/NIAAA NIH HHS/United States
LinkOut - more resources
Full Text Sources
Molecular Biology Databases
Research Materials
Miscellaneous
